
A User’s Guide to Google Analytics Channel Groupings
Learn how Google Analytics Channel Groupings can help reveal your most effective marketing channels.

Google Analytics can seem daunting, even to the most capable digital marketing manager. Few really want to study topics like “Google Analytics Channel Groupings” until they clearly see how much value can be pulled from even a rudimentary knowledge of the platform.
Here’s a mental trick to help you get past the fear: At heart, the Google Analytics beast is simply a collection point. It’s a table of metrics and dimensions collected by a bit of code on your ecommerce website.
Our aim here is to help make sure the reports you pull from that data are as useful and clear as possible. The more confident you get with Google Analytics, the easier the rest of your job will be.
In this guide, we’ll discuss a feature ofGoogle Analyticseveryone who directs the marketing for an ecommerce website should understand and access often: Channel Groupings.
What Are Google Analytics Channel Groupings?
Google Analytics Channel Groupings unveil the sources of your traffic and tell you how much impact you’re getting from each source channel.
Here are some examples of the information you can glean from knowing the significance of each traffic source:
- How does organic (search engine) traffic compare to the visits generated by paid advertisements?
- How many visitors are coming to your ecommerce site from Facebook and other social media channels?
- How well are your guest posting efforts paying off?
- Are your efforts at optimizing your YouTube channel generating visits?
- Which channels need special attention from your content creators?
By accessing and tracking those metrics, you can begin making more informed decisions about where to get the most ROI from your marketing time and budget.
In this guide, we’ll cover how to access your Default Channel Groupings, when you should modify them, and why traffic source data is integral to conversion rate optimization.
Why Should You Worry About Channel Groupings Anyway?
A website without traffic is like a store without customers: no visitors, no sales.
Traffic alone doesn’t paint the entire picture, though. You need the right kind of traffic.
For instance, let’s say you get 1,000 visits from a Facebook ad and 2 percent of that traffic converts to a sale. The average order value (AOV) is $20. Doing the math, that ad generated $400 in sales. You correctly reckon each visit from that ad is worth 40 cents to you. Checking the cost per click, you find you’re spending 80 cents to attract each visitor. Your ad is providing negative ROI.
Here are some of the other questions ecommerce managers can answer by pulling a Channels report:
- Where should I focus my social media budget?
- Are my SEO efforts paying off?
- Which sites are referring the best prospects to me?
- How much traffic did our last press release generate?
- Is guest posting on industry blog sites a wise use of writer time?
Why should an ecommerce manager learn more about how to use Google Analytics Channel Groupings?
The information you gather is like the windshield on your car: It helps you see where you’re going and points out when a course change is indicated.
How to Set Up Your Google Analytics Default Channel Grouping
In this series of quickstart guides for Google Analytics, we’ve repeatedly suggested that it’s best for beginners to begin with a small learning chunk, then build on that capability once confidence is established.
We’ll stick with that approach here by focusing on the Default Channel Grouping and how you can modify it. Once you’re proficient there and want to go deeper, Google Analytics gives you the option to create Custom Channel Groupings.
We’ll also show you can get custom-like views without the need to create additional Groupings.
The screenshot below shows the Default Channel Grouping for TenCoats, the example site we’ve been using for this Google Analytics quickstart series. TenCoats is just now being launched, and the owners (not our clients) offered to give us access to their Google Analytics data to illustrate this series of Google Analytics guides.
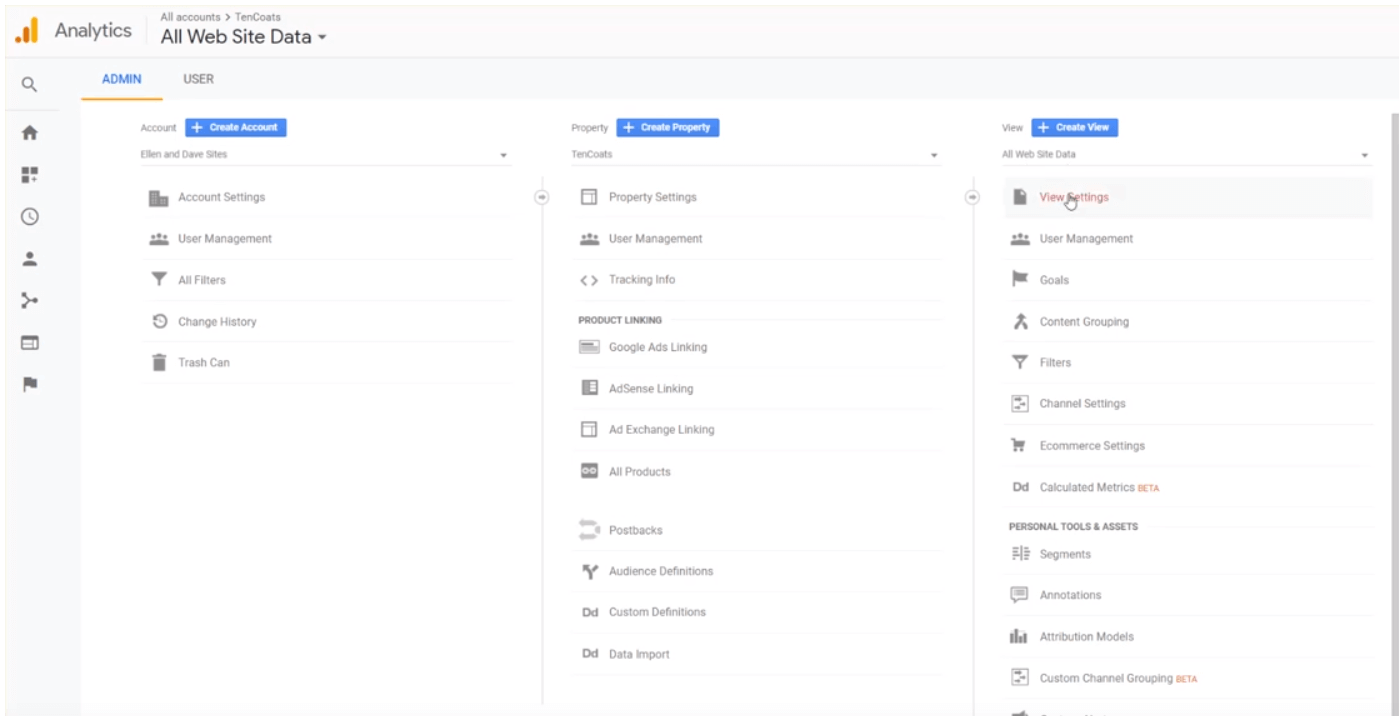
Here’s the path to your own Default Channel Grouping:
- Log in to Google Analytics
- Select the account you wish to view
- Click Admin > View Settings (screenshot above)
- Click Channel Settings > Channel Grouping > Default Channel Grouping (screenshot below)
Enjoying this article?
Subscribe to our newsletter, Good Question, to get insights like this sent straight to your inbox every week.
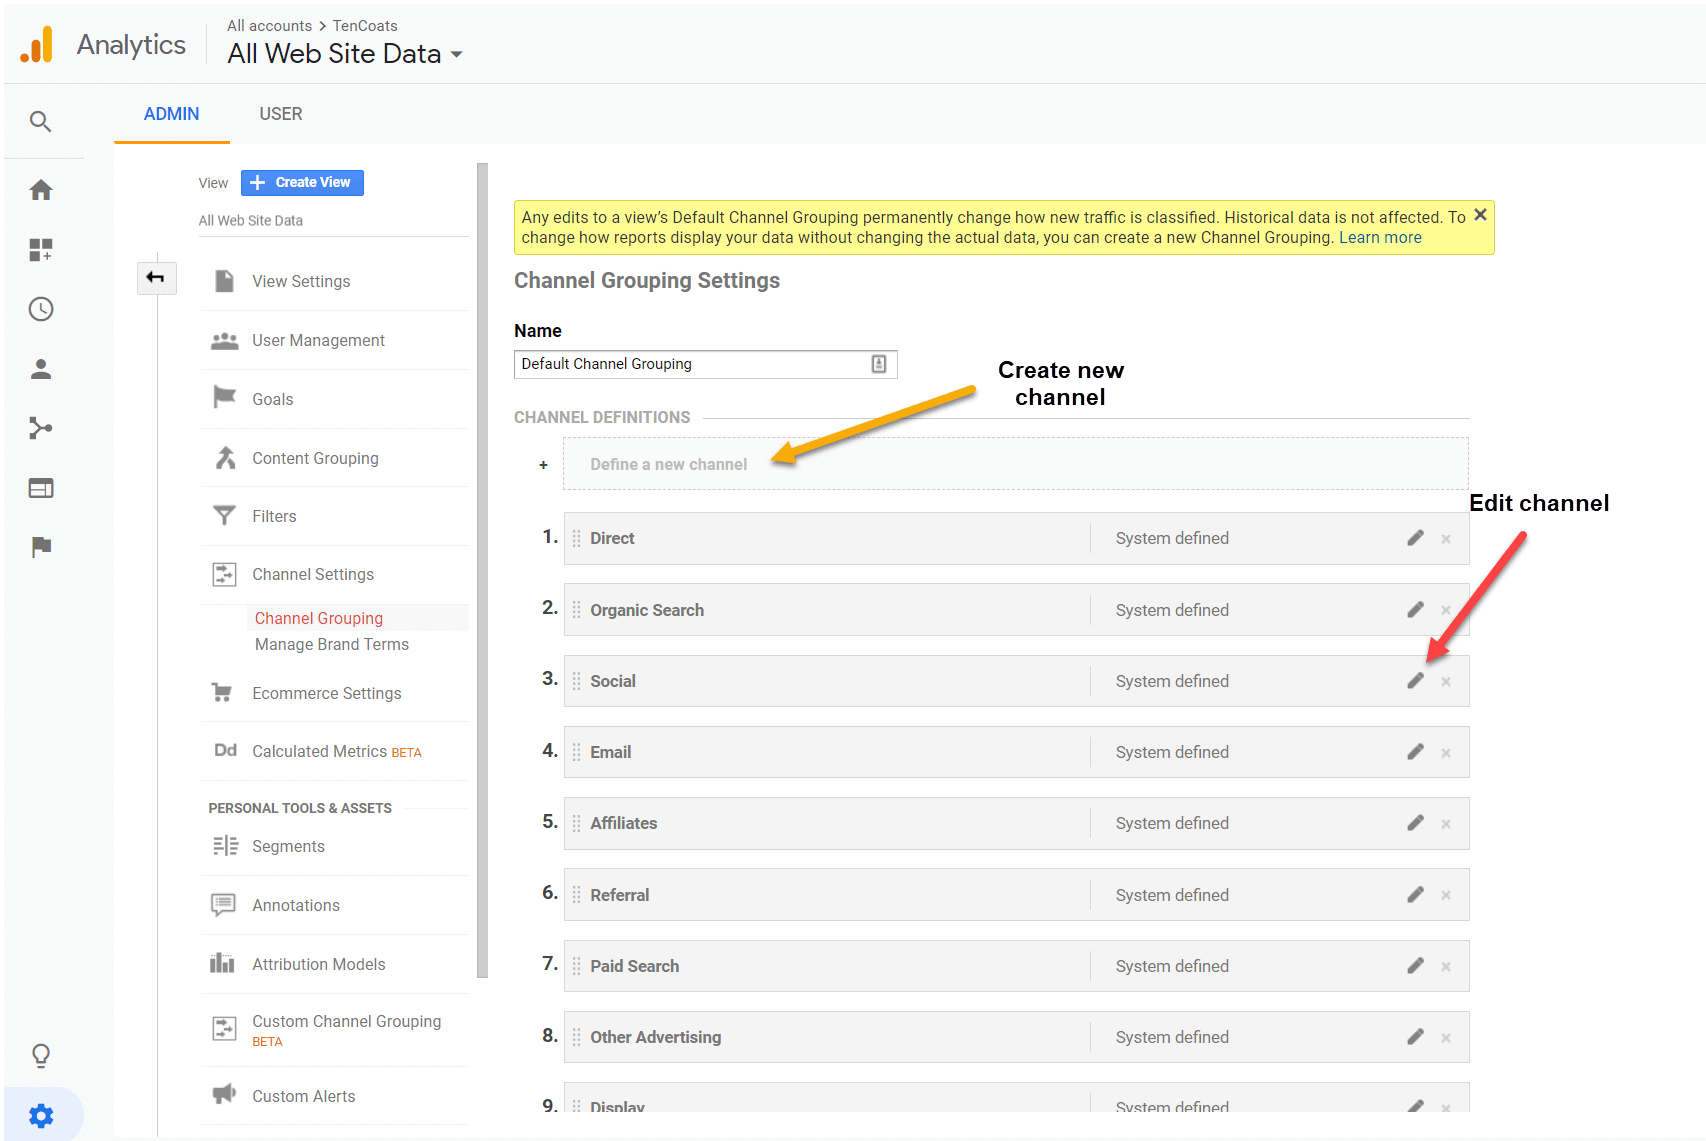
Note that all default channels are marked “System defined.” Many ecommerce managers are satisfied with those selections. Once you get more comfortable with accessing and analyzing the data provided, though, you may want to make some changes (and you’ll definitely want to know about the “hack” we’ll show you below).
Your options are to edit existing Channel definitions, delete existing Channels, and add new Channels. The possibilities are numerous. That’s why we encourage you to use the default options first. That not only relieves confusion and builds confidence, but there’s nothing like hands-on experimentation to spark ideas for the wish list of changes you’re sure to compose.
The screenshot below shows how to get started with defining new Channels and editing existing Channels (when you’re ready to go further).
Some of the Channel changes you may want will require the creation of a new view. Remember, Google Analytics is simply an immense collection of data points. Collecting that data requires only that you install the proper code. Leveraging the data is accomplished by learning how to access the various default views and getting proficient at designing your own custom views of the underlying information.
Whether to stick with the default configurations or opt for a custom report is primarily determined by how granular you want to get.
How to View Traffic Sources by Channel
Here’s an example of how you can view more tightly-focused information, but without the need to create a Custom Channel:
To view traffic by acquisition channel, go to Home > REPORTS > Acquisition > All Traffic > Channels (see the screenshot below).
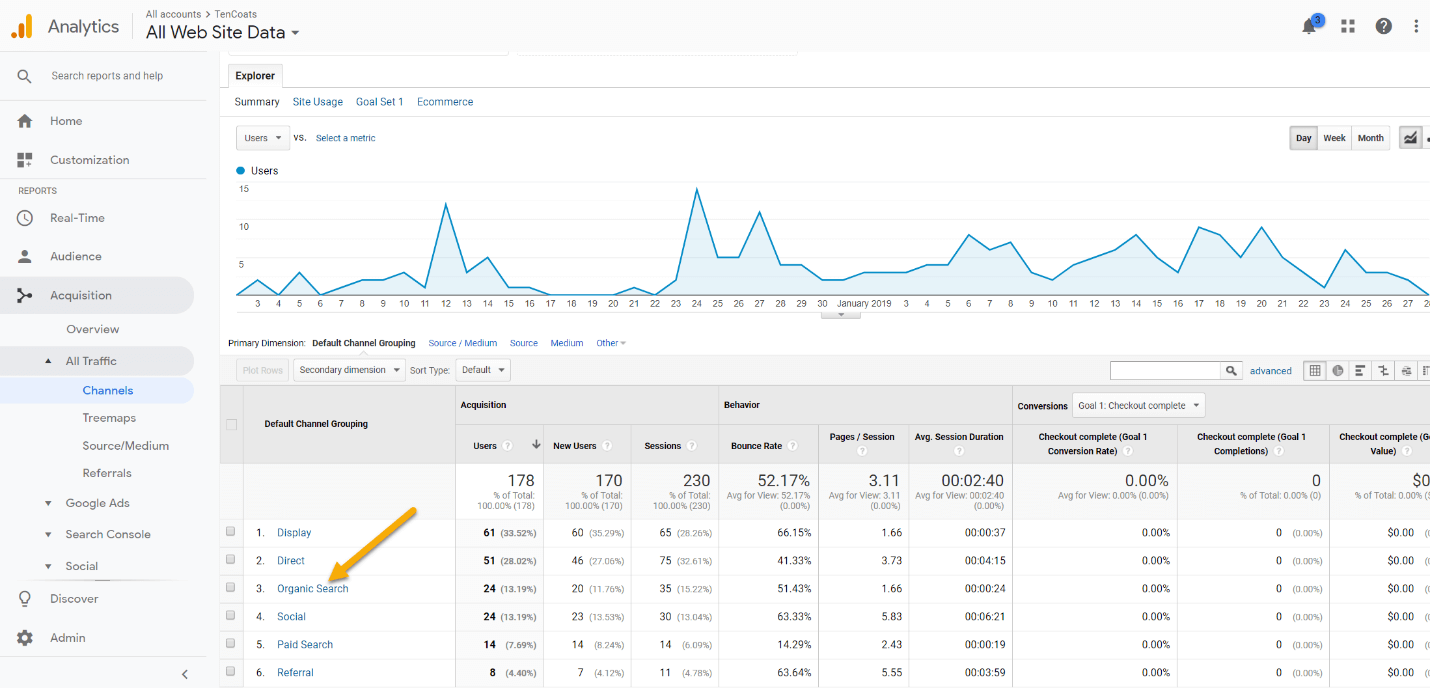
Note that Organic Search is one of the Channel defaults in the Default Channel Grouping (see the screenshot above). If you click on the Organic Search heading, you’ll be presented with another table, where you’ll find information about Keywords used, the number of Users and Sessions, Bounce Rate, and more.
One thing you won’t see in the Organic Search Channel, though, is a breakdown of your visitors that indicates how many came from Bing, YouTube, Facebook, and other sites.
Rather than create a new Channel (or edit an existing one) to view this information, it’s helpful to first see if there’s an existing default view that will provide the data you seek. In this case, there is.
To get a closer look at your traffic sources, look below Channels under All Traffic, and click on Source/Medium. That will not only show the breakdown of your organic traffic, but will list CPC visits and other referral sites. It’s just one of the many data “hacks” you’ll find as you get more familiar with Google Analytics.
Google Analytics Channel Groupings and Conversion Rate Optimization
The more you know about your ecommerce website visitors, the better able you’ll be to convert them from shoppers to customers. Traffic source information can give you a big hand-up in that process.
For example, knowing which channels attract the best prospects allows you to direct more resources and budget to getting even more traffic from that source.
Conversely, if you find that a certain referring site is underperforming—maybe even costing you more than it’s bringing you—it may be wise to pull back on your presence there until you find out what went wrong.
It’s easy to be intimidated by the Google Analytics dashboard, but the effort you invest in learning to pull the information most valuable to you is well worth the time.
Wade in gently. Use this series of quickstart guides as an introduction. Once you’re more comfortable finding your way around, go ahead and start experimenting with custom changes.
One word of warning:
Don’t make decisions based on one view or report. Confirm your theories from several different data viewing angles to be sure your suspicions are accurate. This could save you from making a mistake that might make you cynical about the value of data-driven management.
Take your time. Seek clarity.
Have you ever stared at a graphic or photo for a long time before the lion hiding in the background (or some other visual anomaly) became apparent to you?
Analytics is like that.
If you’ll look long and hard enough, the conclusions you arrive at will often surprise you. They could also open the door to significantly higher conversion rates, more sales, and more profits.
Need help? Contact The Good.
Resources:
- About Channel Groupings
- About Multi-Channel Funnels
- A User’s Guide to Google Analytics Enhanced Ecommerce
Enjoying this article?
Subscribe to our newsletter, Good Question, to get insights like this sent straight to your inbox every week.
About the Author
David Hoos
David Hoos is the former Director of Marketing at The Good and a trusted advisor to marketing experts.