Swiss Gear Priotized Experimentation To Improve Off-Season User Experience
See how Swiss Gear leveraged experimentation to improve off-season user experience with The Good’s Digital Experience Optimization Program™.
The Overview
Swiss Gear are purveyors of the fine Swiss Gear backpacks, luggage, travel accessories, watches, and the makers of the Genuine Swiss Army Knife™.
The Challenge
After the initial launch of Swiss Gear’s website, the brand saw a big spike in traffic and sales, but they were unclear on how to maintain continued online sales and conversion growth. The brand saw solid holiday season sales, but their off-peak times resulted in a noticeable slow down, leading Swiss Gear to consider optimization as a solution to delivering a better experience for existing traffic.
The Process
To discover why Swiss Gear was not converting their visitors at their full potential during off-peak seasons, The Good began by digging into the data site visitors were producing – helping Swiss Gear to track the clicks and movements visitors were taking on their site. We started with an audit and testing roadmap formation, and moved into to our Digital Experience Optimization Program™ for structured testing and monthly, iterative improvements.
Upon conclusion of the audit, we noticed key characteristics of their audience and how they were interacting online during off-peak seasons, which helped us build the A/B and multivariate testing roadmap. We then tested experiences to streamline the user experience.
The Solution
In the first stage of our work with Swiss Gear, we took a deep look at their site analytics and visitor interaction data through our audit, in order to understand on a deeper level who their consumer profiles are and their on-site behaviors. In this initial stage, we discovered a number of customer types that were engaging with the website in unique ways and encountering unique conversion blockers.
We discovered one segment that was visiting the website primarily on their mobile devices while located in major travel hubs, indicating they had a high affinity for travel. A trigger for them could be traveling in an airport, seeing a Swiss Gear product, and visiting the website on a mobile device as a result. Due to these discoveries, our optimization efforts were directed toward improvements in mobile site optimization, email list growth, and reduction of site abandonment.
The next segment, in contrast, was visiting the site from a desktop computer, arriving by way of paid search. A trigger for this segment is looking for the equivalent of the “swiss army knife of backpacks” and meticulously browsing until they find the perfect backpack. As a result, we optimized the site for shoppers looking for product feature terms and specifications. Our improvement efforts for this audience were directed toward easing purchase decision making, building an effective content strategy with copywriting, and focusing on conversions from paid search sources.
Finally, we identified a third major audience segment. We noticed that they were often visiting more than once a day and typically to specific product pages. This segment is savvy at seeking online deals and knows how to navigate several competing sites quickly to compare a single product. Our comprehensive approach to solve the challenges was to first move toward a completely pain-free user experience to reduce user experience annoyances and price research disruptions.
Next, our Digital Experience Optimization Program™ branched into several other focus areas to comprehensively target the needs of each consumer segment. To begin making additional improvements to the site, we developed a variety of experiments around these focus areas. Our first experiment series focused on email list growth. We noticed that the footer signup was seen by less than 5% of site visitors, and that of all the pop-ups and exit intents, only 1.14% converted to signups.
To solve this, we developed a number of signup box test variations that included changes to fields, form factor, device types, timing, messaging, and imagery. The winning tests and learnings from these experiments resulted in a 328% increase in email signups.
At the same time, we also developed tests focused on improving the mobile experience of the site. Based on heatmap data, it was clear that users preferred to use the mobile menu to navigate. Unfortunately, the menu was complex, making it easy to make mistakes like selecting the wrong item. To counteract that, we experimented with a variety of iterations of the mobile menu finally landing on simpler menu-driven interface on the homepage. This decreased the mobile bounce rate by 8%, and increased time on site by 84%.
We blended a number of these insights and tested adding a business traveler image to the top of the mobile menu, since we knew business travelers were most often browsing on mobile devices. This test improved visits to luggage pages by 47%. Through overall coordinated testing efforts, the mobile device conversion rate increased 30% YoY during the holiday season.
After that, we experimented with adding some simple visual cues to the category page. We added new shortcut buttons that ultimately increased the visibility of filter shortcuts and their usage increased by 59%. Combined with optimization of content there was an increase in revenue per visit by 28%.
Next, for the same audience, we tried some experiments around tagging products as best sellers with the expectation that this would increase visits and conversions to these product pages. Holiday shoppers were not influencers by the best seller buttons on the product page. However, among those shoppers who saw a best seller label on the product page, conversions increased by 17.2%.
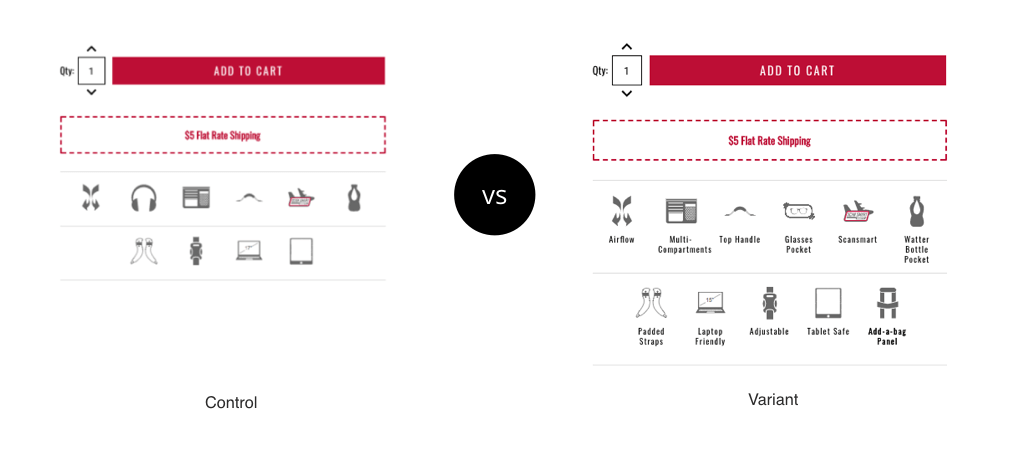
We ran another test based on the hypothesis that highlighting product features using icons and text will improve conversions for feature-rich products. Text descriptions under the icons produced 10% more revenue per user. Also, these users were less likely to click into a product description, showing that they were relying on icons to learn about the product.
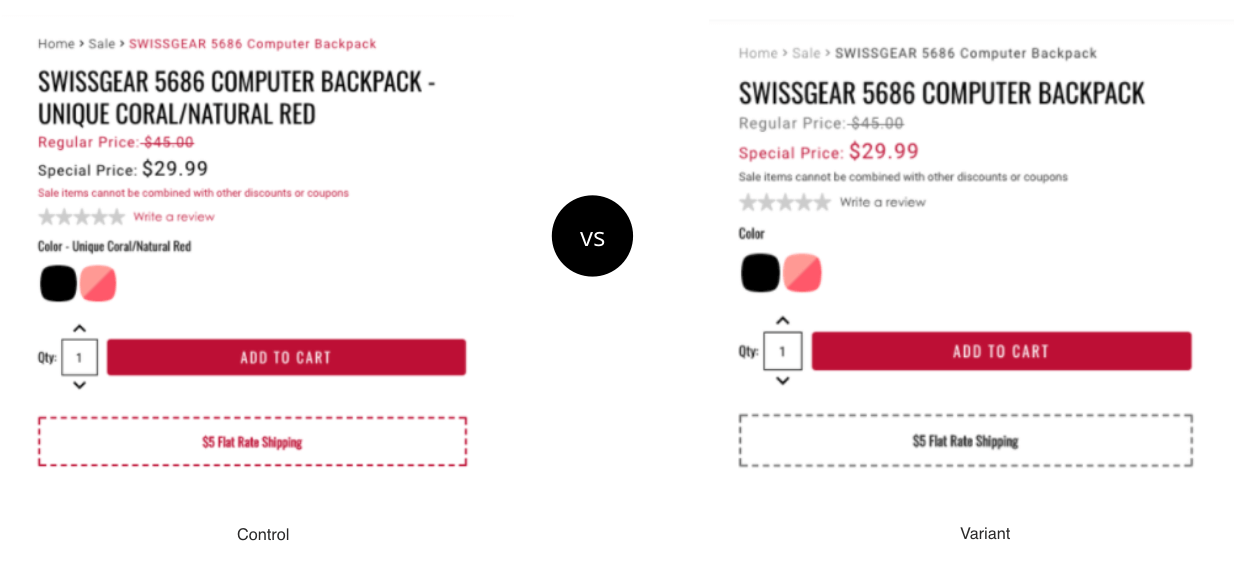
Finally, as part of the pain-free UX initiative, we sought to reduce visual noise on the product detail pages and improve focus on the product sales price. These tests produced an increase in conversions of 52%. During the holiday season, that conversion rate change increased up to 137%.
The Results
While The Good’s engagement with Swiss Gear is ongoing, the initial audit and ongoing iterative tests have helped drive better engagement and more revenue. In fact, as a result of work with The Good, Swiss Gear saw their holiday season conversion rate grow 14.1% YoY, their average order value grow 20.1%, and their overall online revenue grow a significant 132.7%.
“The Good’s holistic approach and attention to detail was essential in identifying the best areas to optimize our site. In the end, their testing program helped drive big improvements to our customer experience, increased our return on ad spend, and helped boost our online revenue by 132%.
Michael Pulichino, Managing Director, Swiss Gear
How Swiss Gear Achieved A 14.1% Conversion Rate Increase YoY Working With The Good
The work we completed for Swiss Gear included a Digital Experience Optimization Audit™ and a custom Digital Experience Optimization Program™.