
A User’s Guide to Google Analytics Enhanced Ecommerce
Google Analytics tracking is foundational to conversion rate optimization. Here’s a simple guide to get started with Enhanced Ecommerce reporting.

Analytics tracking and analysis are foundational to conversion rate optimization. That’s why the most successful ecommerce managers use a robust tool like Google Analytics Enhanced Ecommerce to observe how visitors interact with their sites.
Savvy ecommerce managers sensed the potential benefits of Google’s Enhanced Ecommerce reports when they left beta testing in November 2014. Google announced the development as “a complete solution for ecommerce businesses.”
It was suddenly possible for ecommerce managers to get a panoramic view of visitors interacting with their website—a level of insight previously available only to those willing to invest a considerable amount of money.
Are you taking advantage of the incredible power Enhanced Ecommerce reports offer?
If you’re not, you’re giving your competitors a huge advantage.
If you’re already leveraging Enhanced Ecommerce reporting features, are you taking full advantage of the possibilities?
In this brief guide, we’ll cover:
- What Google Analytics Enhanced Ecommerce reports are
- Why every ecommerce website manager should be taking advantage of them
- How you can get started with enhanced ecommerce reporting
What Is Enhanced Ecommerce Reporting?
Google Analytics Enhanced Ecommerce reporting allows you to collect data related to ecommerce transactions: item data, impression data, product data, promotion data, and action data. This information gives you a snapshot of your company’s health by providing an overarching view of how visitors interact with your ecommerce website.
With Google Analytics Enhanced Ecommerce tracking properly installed, you’ll be able to observe user engagement actions and metrics like these:
- Campaign views
- Campaign clicks
- Product views
- Product clicks
- Product detail page views
- Shopping cart additions
- Shopping cart changes
- Shopping cart abandonment
- Coupon code activity
- Purchase activity
- Refund requests
- Average order value (AOV) and other metrics
Prior to Enhanced Ecommerce reporting, ecommerce managers were hard-pressed to see activity occurring before a sale was made. With Enhanced Ecommerce reporting, a holistic vision of the path to sales is accessible to all who take the time and make the effort to analyze the data.
Why Use Enhanced Ecommerce?
At its core, conversion rate optimization is the continual sharpening of your website design, content, and product offers to generate desired outcomes. Enhanced Ecommerce can be a primary tool in your CRO strategy.
Information gained from your analytics process is the dashboard on your ecommerce bus. Armed with the insight it provides to user activity on your ecommerce site, you can effectively steer in the direction of more sales and increased profitability.
Many ecommerce managers find Google Analytics to difficult to work with. This guide will take the mystery out of Enhanced Ecommerce reporting and help you gain the confidence to not just employ the tool but to get maximum returns from it.
How to Set Up Enhanced Ecommerce
Google Analytics Enhanced Ecommerce can help you understand how visitors are interacting with your ecommerce website and give you the information necessary for making data-based CRO decisions.
If you can’t set up Enhanced Ecommerce, however, or are unsure about how to use the tool, the advantages it provides aren’t attainable.
Let’s walk through the set-up steps together:
1. Begin with your strategic plan
Determine which points and actions along your path to purchase provide the most valuable information. Don’t try to monitor every action; you’ll get overwhelmed.
For starters, your list might include data points that will answer questions like these:
- What is your overall conversion rate (unique sales/unique visitors) for selected periods?
- What are your total sales for selected periods?
- What is your average order value (AOV)?
- What is your cart abandonment rate?
- What is your return percentage for a set period?
- Which products are most and least popular?
- Which of your marketing campaigns are driving the most and least buyers to your ecommerce website?
Remember to choose the performance indicators most valuable to you and begin with those. Once you’re familiar with the tool and the available reports, go ahead and add more functionality as needed. But beware of data overload—stick to functionality that supports your strategy.
2. Install the tracking code on the pages you want to monitor
You have two options: install the code manually or use the Enhanced Ecommerce plugin. If you’re using WooCommerce, Shopify, or another ecommerce content management system to present your products, there will quite likely be a special third-party plugin available through that system to facilitate Enhanced Ecommerce
The Enhanced Ecommerce plugin is ecommerce.js. This is the one step where you should either be versed in backend work or get the assistance of an experienced developer. Google has the entire process and requirements documented here: Enhanced Ecommerce Tracking.
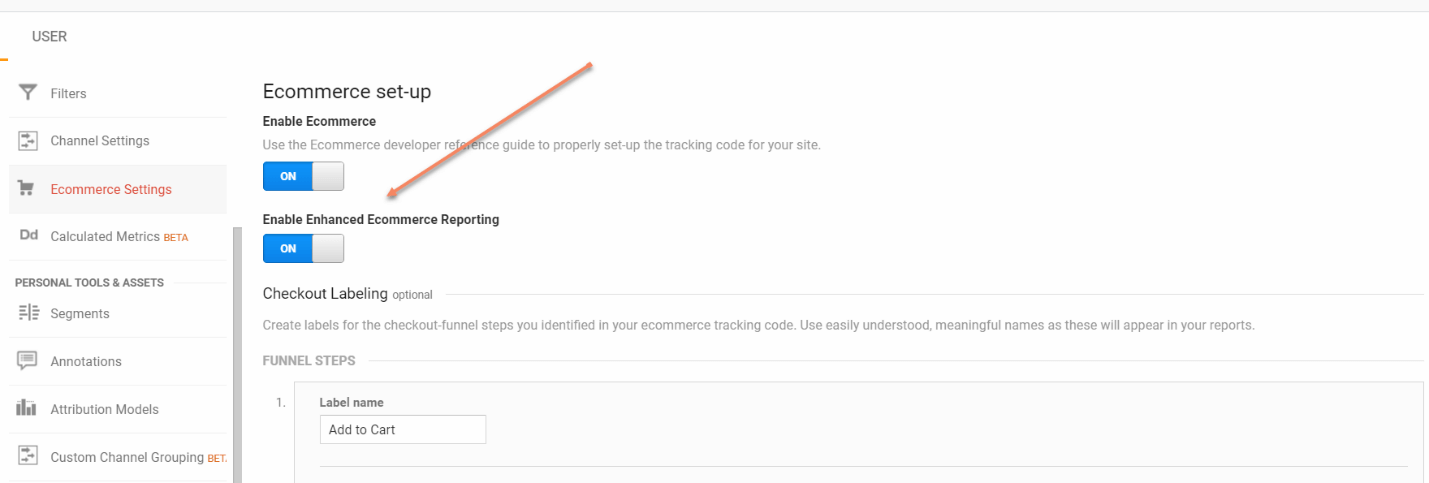
3. Enable Enhanced Ecommerce in your Google Analytics account
Advanced users may want to implement Enhanced Analytics using Google Tag Manager (GTM) instead of the Google Analytics dashboard. If that’s your course, you’ll find the developer guide here: GTM Developer Guide.
The simpler way is to install the code, then flip the switch in your analytics dashboard (see the screenshot below). The path is Account > Admin > Ecommerce Settings > Ecommerce set-up.
Three Categories of Enhanced Ecommerce Reports
Your own needs, strategy, and setup will determine which Enhanced Ecommerce reports you’ll pull and analyze.
There are three general categories of information to consider:
- Revenue and Conversion Rate Data information keeps you informed on stats like total sales and overall conversion rate. Daily tracking of these metrics provides a window to profitability and allows you to view year-to-year comparisons of ecommerce activity and patterns.
- Transaction Data looks closer at individual conversions to provide stats like average order value and the average quantity of items purchased per sale.
- Marketing Data gives you feedback on promotions. You can not only track overall campaign activity, but you can break metrics down to individual products, categories, and brands.
There’s plenty of flexibility available. You’re not stuck with generic returns looking at the tired data everyone else is tracking. That said, there are a few reports most ecommerce website managers will want to see.
Three Crucial Enhanced Ecommerce Reports
The following reports are simple to generate, provide critical information and can help you gain the confidence and familiarity you’ll need to go deeper into Enhanced Ecommerce reporting.
The Sales Performance Report
The Sales Performance Report is an ecommerce manager’s ready assistant. It stands by 24/7 to provide solid data to inform decisions.
For a look at sales performance by date or transaction, you’d be hard-pressed to beat the Enhanced Ecommerce Sales Performance report.
Metrics in this report include:
- Total shipping charges
- Total tax charges
- Amount refunded
- Shipping charges
- Total revenue (with or without tax and shipping)
The graphical interface of this report lets you view and analyze sales for the period you define. You’ll be able to discern seasonal fluctuations, observe the effect of your campaigns, and identify trends.
The path to viewing this report from the Google Analytics dashboard is Property > Site Data > Conversions > Ecommerce > Sales Performance.
This report is only viewable once ecommerce tracking is properly configured. If you can’t access it, go back to the section on installing Enhanced Ecommerce Tracking.
The Product Performance report
This report provides a panoramic view of how well your products are moving. Your view can be as narrow as a certain SKU number or as wide as the entire brand.
Product performance metrics include:
- Average quantity sold
- Average price per product
- Unique purchases
- Amount refunded
- Quantity sold
- Product revenue
Shopping behavior metrics look at your cart-to-detail rate (number of products added to cart divided by product detail views) and buy-to-detail rate (number of products purchased divided by product detail views).
You can also call up a graphical portrayal for the data, structured by the time constraints you choose.
The path to viewing this report from the Google Analytics dashboard is Property > Site Data > Conversions > Ecommerce > Sales Performance.
The Ecommerce Overview report
Many ecommerce managers like to begin with the overview. We list it last here to encourage you to experiment with the many reports offered by Google Analytics.
Overviews are certainly valuable. However, the practice of looking deeper into the behavior of visitors who arrive at your site—then observing where they go and what they do—can give you tremendous insight that the Overview report cannot provide.
The Ecommerce Overview summarizes these metrics:
- Average order value (AOV)
- Marketing initiatives
- Top and bottom sellers
- Ecommerce conversion rates
- Transactions performed
- Revenue flow
Here’s the path for this report: Property > Site Data > Conversions > Ecommerce > Overview.
Ecommerce Enhancement Made Easy
Some say there’s no easy or straightforward way to approach Google Analytics. Either you love crunching numbers or you don’t.
We don’t agree with that statement.
At The Good, we’ve seen many ecommerce managers move from fearing Google Analytics and avoiding the seeming complexities, to quietly adopting one part of this powerful platform at a time until they became analytics champions and evangelists.
Don’t let the learning curve keep you away from grasping something that will serve you and your company exceptionally well.
You can get on board with Enhanced Ecommerce in one afternoon if you follow the directions we’ve set forth here:
- Begin by identifying the analytics information most valuable to the management of your particular ecommerce website.
- Install the Enhanced Ecommerce tracking code to capture the data you need.
- Collect a few basic reports, get used to working with them, and then let them lead you to other analytics gaps that need to be filled.
If you run into a stuck point and need help, don’t give up. Our team at The Good is experienced at helping clients get out of the analytics weeds and back on track. All you need to do is contact us. We’re here to help.
RESOURCES:
- 3 Web Analytics Mistakes That Can Kill Your Business (and How to Fix Them)
- Key Google Dashboards to Make Your Analytics Actionable
- Enhanced Ecommerce Reports
Enjoying this article?
Subscribe to our newsletter, Good Question, to get insights like this sent straight to your inbox every week.
About the Author
David Hoos
David Hoos is the former Director of Marketing at The Good and a trusted advisor to marketing experts.