
The Product Manager’s Guide to Choosing the Right Research Method
We collected common UX research questions and got our team of experts to share how they would answer them.

Every product team faces similar questions: Why aren’t users converting? Which design should we choose? What features do users actually want? The challenge isn’t just finding answers; it’s knowing which research method will get you there efficiently.
This guide matches common business questions to the right ux research approaches. Whether you need answers in days or require deeper investigation, you’ll find a practical path forward.
How to use this guide
Each section follows the same structure:
- The question – The business challenge you’re facing
- Why it matters – The impact of not having an answer
- Research approach – Which methodology to use
- Timeline – How quickly you can get results
- What you’ll learn – The specific insights you’ll gain
- Real example – How we’ve applied this in practice
Choose your approach based on your timeline, risk level, and how confident you need to be in the answer.
The research framework behind these methods
At The Good, we organize research methods using the Double Diamond framework.
Understanding this structure will help you choose the right approach for your specific challenge.
The two diamonds: design the right thing, then design the thing right
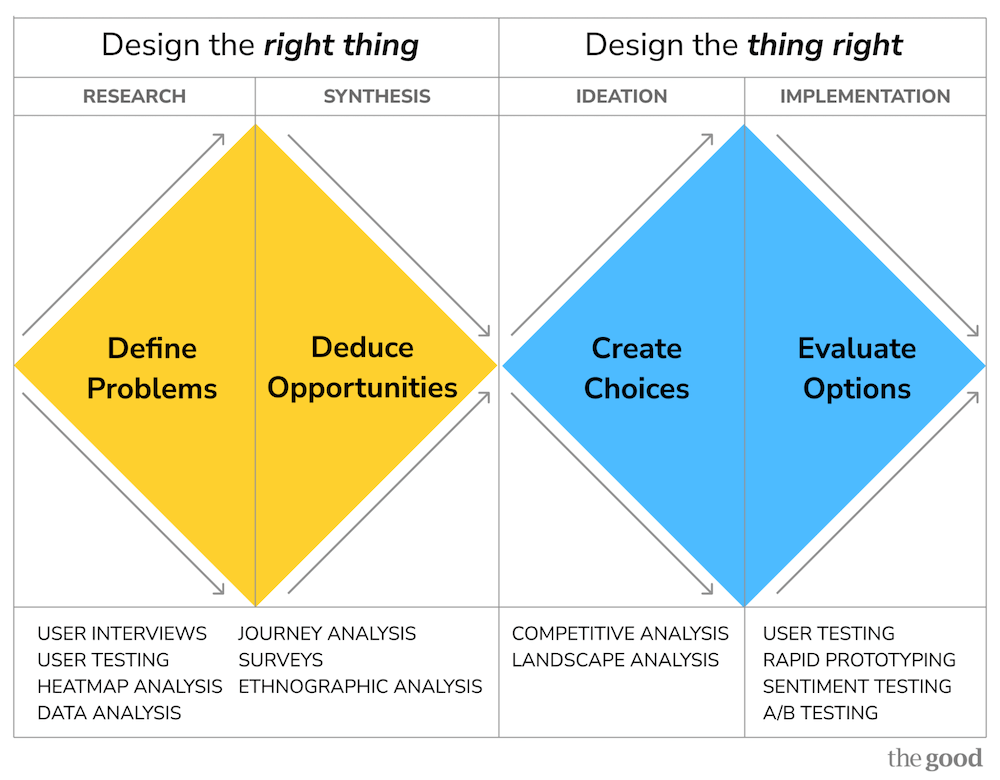
The First Diamond: Design the Right Thing (Generative Research)
- Define Problems (Research): Gather data to understand what’s broken and why
- Deduce Opportunities (Synthesis): Analyze findings to prioritize which problems matter most
The Second Diamond: Design the Thing Right (Evaluative Research)
- Create Choices (Ideation): Explore multiple solution approaches
- Evaluate Options (Implementation): Validate which solution actually works
How this affects which method you choose
The questions in this guide are organized by the type of decision you need to make, but they map to different phases of the Double Diamond:
First Diamond questions help you understand problems:
- Why aren’t people completing our signup flow?
- Why are users churning?
- What opportunities are we missing?
These require generative research methods like user testing, interviews, journey analysis, and competitive analysis.
Second Diamond questions help you choose solutions:
- Which design will convert better?
- Should we proceed with this redesign?
- Which message will motivate users to take action?
These require evaluative research methods like rapid testing, prototype testing, A/B testing, and preference studies.
Not sure which diamond your question belongs to? If you’re asking why or what, you’re in the first diamond. If you’re asking which or will this work, you’re in the second.
Registration & Acquisition
Why aren’t people completing our signup flow?
Why it matters
Every abandoned registration represents lost revenue. A 10% improvement in signup completion can significantly impact customer acquisition costs and growth metrics.
Research approach
Journey analysis combined with user testing (moderated or unmoderated)
Timeline
- Quick diagnosis: 5-7 days (unmoderated testing)
- Deep investigation: 20+ days (moderated interviews)
What you’ll learn
- Exactly where users abandon and why
- What information requests feel invasive or unnecessary
- Which error messages are confusing
- How expectations set by marketing compare to the actual signup experience
- What competing products do differently
Real example
When Autodesk experienced high cart abandonment, heatmap analysis showed users avoiding the signup area and searching elsewhere on the page. User testing revealed the page prioritized “sign-in” while burying “sign up” and “continue as a guest” options, causing confusion about how to proceed. Giving greater prominence to all three options and streamlining the checkout process helped Autodesk achieve an 11% year-over-year increase in subscriptions.
Best for: Conversion rate optimization, reducing acquisition costs
Which signup flow design will convert better?
Why it matters
Design debates can stall projects for weeks. Testing variations before building prevents expensive post-launch discoveries.
Research approach
Rapid preference testing or prototype testing
Timeline
- Rapid preference test: 2-4 days
- Prototype testing: 5-7 days
What you’ll learn
- Which design elements increase motivation to proceed
- Where users expect to find specific information
- Which copy/messaging resonates most
- What creates trust vs. skepticism
- Comparative performance across variations
Real example
When Adobe needed to choose between four different sign-in modal variations, we conducted rapid preference testing, asking users, “Which option makes you most likely to sign in?” This provided clear quantitative data on which design would likely perform best.
Best for: Making design decisions quickly, de-risking changes before development
Should we gate features or offer free access?
Why it matters
Paywall strategy directly impacts both conversion rates and revenue. Get it wrong, and you either leave money on the table or drive users away.
Research approach
Competitive analysis combined with user testing
Timeline
- Competitive benchmark: 5-7 days
- User testing: 7-10 days
What you’ll learn
- What features competitors gate vs. offer freely
- How users perceive value in gated vs. ungated features
- Which features drive conversion vs. which build engagement
- User expectations based on industry norms
- Breaking points where users abandon vs. upgrade
Real example
For The Telegraph, we analyzed session recordings and competitive paywall strategies across news publications to understand optimal gating approaches. Testing revealed a specific gating strategy increased conversions by 5% while reducing immediate cancellations by 30%.
Best for: Pricing strategy, feature packaging decisions
Onboarding & Activation
Why aren’t new users adopting key features?
Why it matters
Users who don’t reach activation milestones churn faster. If they don’t experience core value quickly, they won’t stick around.
Research approach
User testing with new users + heatmap/session recording analysis
Timeline
- Quick diagnosis: 5-7 days
- Comprehensive study: 10-15 days
What you’ll learn
- Whether users understand what features are available
- If feature discovery mechanisms are working
- What mental models users bring that clash with your product
- Where in-app messaging helps vs. creates noise
- How quickly users can accomplish their first important task
Real example
One of our SaaS clients noticed low AI Assistant adoption on iOS vs. Android. Journey analysis revealed that iOS users weren’t offered a sign-up option during the AI task flow, while Android users were. This UI difference helped to explain the adoption gap.
Best for: Improving activation rates, reducing time-to-value
What should our onboarding include?
Why it matters
Onboarding sets the tone for the entire customer relationship. Too much information overwhelms; too little leaves users confused.
Research approach
Journey analysis of current experience + competitive analysis + user interviews
Timeline
- Comprehensive study: 15-20 days
What you’ll learn
- What information users need immediately vs. what they can discover later
- Which tasks users are trying to accomplish first
- How your onboarding compares to user expectations set by similar products
- Where users get stuck or confused
- What creates aha moments that drive engagement
Real example
For our client, a custom design tool competing with Canva, user testing revealed that users were unclear about where to take action and how to save designs. We recommended adding a brief onboarding flow highlighting the most valuable features and gating key functionalities like downloading designs or accessing premium templates to encourage early account creation for a more personalized experience.
Best for: Reducing churn, improving early engagement metrics
Are our tooltips/coachmarks actually helping?
Why it matters
In-app guidance can accelerate learning or create annoying clutter. You need to know which yours is doing.
Research approach
User testing with think-aloud protocol + analytics review
Timeline
- 5-7 days
What you’ll learn
- Whether users read or dismiss tooltips
- If guidance comes at the right moment or interrupts flow
- What questions users have that tooltips don’t answer
- Whether tooltips help or just create more clicks to dismiss
Real example
During user testing of a client’s apps, we discovered that users said coachmarks were not perceived as useful and didn’t provide enough detail on how to use features because they felt like advertising rather than education.
Best for: Optimizing in-product education, reducing support requests
Core Product Experience
Why is feature adoption so low?
Why it matters
You invested in building features users aren’t using. Before building more, you need to understand why.
Research approach
Session recording analysis + user interviews + analytics deep-dive
Timeline
- 10-15 days
What you’ll learn
- Whether users know the feature exists
- If they understand what it does and when to use it
- Whether it solves a real problem in their workflow
- If there are usability barriers preventing use
- What alternative approaches users take instead
Real example
We analyzed tool use sequences in a suite of SaaS products, revealing that certain feature combinations strongly predicted retention. This showed which features were truly valuable vs. which were rarely used even by active customers.
Best for: Product roadmap prioritization, feature improvement decisions
Which features should we build next?
Why it matters
Resources are limited. Building the wrong features means not building the right ones.
Research approach
MaxDiff analysis (survey-based prioritization) + user interviews
Timeline
- Survey design and analysis: 10-12 days
What you’ll learn
- Relative importance of different features to users
- Which features differentiate you from competitors
- What users would pay for vs. what they expect for free
- Differences in priorities across user segments
Real example
We conducted a MaxDiff analysis for a SaaS company to understand which trust signals (customer count, certifications, testimonials, etc.) mattered most to buyers. This created a clear hierarchy for prioritizing homepage messaging.
Best for: Roadmap planning, resource allocation decisions
Is our navigation structure working?
Why it matters
If users can’t find features, they might as well not exist. Navigation problems compound across every user session.
Research approach
Tree testing (for early-stage validation) or first-click testing (for existing interfaces)
Timeline
- 3-5 days
What you’ll learn
- Where users expect to find specific features
- Which labels are clear vs. confusing
- Whether your information architecture matches user mental models
- Success rates for common navigation tasks
- Time required to locate features
Real example
We conducted tree testing on Adobe product navigation, asking users to locate specific functions (like collect feedback on a document). This revealed which navigation paths were intuitive and which caused confusion.
Best for: Information architecture decisions, menu structure optimization
Messaging & Communication
Which message will motivate users to take action?
Why it matters
The difference between meh and must have often comes down to how you frame value.
Research approach
Rapid preference testing
Timeline
- 2-4 days
What you’ll learn
- Which messaging increases stated intent to act
- What value propositions resonate most
- Which tone (benefit-focused vs. feature-focused) works better
- How different user segments respond to messaging
Real example
We tested paywall messaging for The Telegraph, comparing “You’ve reached your article limit” (problem-focused) against “Register to read” and “Subscribe for unlimited access” (action-focused). The action-focused messaging that explicitly told users what to do resulted in a 5% increase in paid conversions.
Best for: Landing page optimization, CTA improvement, email campaigns
What should our welcome email series include?
Why it matters
First impressions shape the entire customer relationship. Get onboarding emails wrong, and you lose engagement before it starts.
Research approach
Journey analysis + competitive analysis + email testing
Timeline
- Competitive benchmark: 5-7 days
- Email sequence testing: 10-12 days
What you’ll learn
- What questions users have at different stages
- When to introduce different features vs. when it’s overwhelming
- Which educational content drives engagement vs. gets ignored
- How your sequence compares to industry standards
- Optimal frequency and timing
Real example
For a client, we mapped the first 30 days of emails across different product and entitlement combinations, identifying exactly where sequences fell short and which messages successfully drove users back into the product.
Best for: Improving activation, reducing early churn
Design & User Interface
Should we proceed with this redesign?
Why it matters
Major UI changes carry significant risk. Users resist change, and poor execution can tank satisfaction scores.
Research approach
User testing with task completion + satisfaction measurement
Timeline
- 7-10 days
What you’ll learn
- Whether users can still complete core tasks efficiently
- What new friction points the redesign introduces
- How satisfaction compares to the current experience
- Which elements of the new design work well vs. create confusion
Real example
When Ironman 4×4 America faced a complex website migration to Shopify, the team was getting bogged down in opinions about checkout processes and site design, risking half their development budget on features that might not perform. Through rapid prototyping and continuous testing with The Good, they tested designs throughout the development process rather than waiting to launch a “perfect” site, de-risking the replatform by validating what customers actually wanted before building it.
Best for: De-risking major changes, preventing satisfaction drops
Which design option should we choose?
Why it matters
Design debates can stall projects indefinitely. Quick validation lets you move forward confidently.
Research approach
Rapid preference testing or design survey
Timeline
- 2-4 days
What you’ll learn
- Which design users prefer and why
- What stands out as particularly effective or problematic
- How well each design communicates intent
- Qualitative feedback on specific elements
Real example
We conducted rapid testing comparing multiple modal designs, giving Adobe quantitative data on user preferences within days rather than weeks of debate.
Best for: Breaking design deadlocks, validating directions quickly
What are users interested in?
Why it matters
Understanding actual behavior (not just stated preferences) reveals what draws attention and what gets ignored.
Research approach
First-click testing or heatmap analysis
Timeline
- First-click test: 3-5 days
- Heatmap analysis: 1-3 days (if data exists)
What you’ll learn
- Whether users click where you expect
- What elements are misleading or confusing
- If primary actions are prominent enough
- Where attention is actually focused vs. where you want it
Real example
Heatmap analysis for Munchkin revealed heavy user attention on navigation elements, with shoppers looking around and peeking into different mega menu dropdowns. This “hunting and pecking” behavior showed that the navigation structure wasn’t efficiently helping users find specific products, leading to recommendations for improved categorization and labeling.
Best for: Interface optimization, reducing user errors
Competitive Intelligence
How does our experience compare to competitors?
Why it matters
Users judge you against alternatives. If competitors offer better experiences, you’ll lose customers, even if your product is objectively good.
Research approach
Competitive analysis (heuristic evaluation)
Timeline
- Quick scan: 5-7 days
- Comprehensive analysis: 10-15 days
What you’ll learn
- Where competitors excel that you don’t
- Industry best practices you’re missing
- Opportunities to differentiate
- User expectations set by market leaders
- Pricing and feature packaging strategies
Real example
We evaluated competing PDF scanner apps’ download experiences to identify opportunities for Adobe to increase likelihood of download and installation.
Best for: Strategic planning, identifying improvement opportunities
What are best-in-class approaches to [specific problem]?
Why it matters
Why reinvent the wheel? Understanding proven approaches across industries accelerates your learning.
Research approach
Landscape analysis (broader than direct competitors)
Timeline
- 7-10 days
What you’ll learn
- Patterns across successful implementations
- Multiple viable approaches to consider
- What users have already learned from other products
- Edge cases and variations to consider
Real example
When working with regulated SaaS companies struggling with growth constraints, we conducted a landscape analysis of optimization approaches across healthcare, fintech, and government software companies. This cross-industry review revealed alternative onboarding experiences, giving teams multiple proven approaches rather than trying to force traditional product-led growth tactics that don’t fit their reality.
Best for: Solving new problems, avoiding common mistakes
Retention & Growth
Why are users churning?
Why it matters
Retention compounds over time. A 5% improvement in retention can double customer lifetime value.
Research approach
In-depth interviews with recent cancelers + cancellation flow analysis
Timeline
- 10-15 days
What you’ll learn
- Real reasons for cancellation (not just what they select in a dropdown)
- Whether they’re leaving for competitors or abandoning the category
- What would have convinced them to stay
- Patterns across different user segments
- Whether pricing, features, or experience drove the decision
Real example
For Helium 10, user testing and registration form analysis revealed that over 28% of users left without interacting with the form, and 39% of sessions resulted in failed submissions. Users couldn’t understand core benefits or see what they’d receive by signing up. Lack of benefits language and social proof meant users didn’t have confidence in the value proposition before committing to paid plans.
Best for: Reducing churn, informing retention strategies
Is there anything we can do to save canceling customers?
Why it matters
Save offers can recover revenue, but wrong offers train users to cancel for discounts.
Research approach
Competitive analysis + rapid testing of offer variations
Timeline
- Competitive analysis: 5-7 days
- Offer testing: 3-5 days
What you’ll learn
- What competitors offer during cancellation
- Which offers resonate with different cancellation reasons
- How aggressive to be with discounting
- Whether feature-based or price-based saves work better
Real example
We analyzed cancellation flows across 11 productivity apps, documenting everything from how they acknowledged loss to discount structures to multi-step save attempts.
Best for: Building save offer strategies, optimizing cancellation flows
How do we win back churned customers?
Why it matters
Reacquisition is often cheaper than new acquisition, but only if you understand why they left and what changed.
Research approach
User interviews with recyclers (customers who left and returned)
Timeline
- 10-15 days
What you’ll learn
- What prompted them to return
- How their needs changed during the gap
- What messaging would have brought them back sooner
- Whether product improvements or external factors drove return
Real example
We conducted moderated interviews with users who had canceled subscriptions and then returned (“recyclers”), helping to understand canceler and reactivation behavior patterns. These interviews revealed the specific life circumstances and product changes that brought users back, informing both winback messaging and product priorities for different churned user segments.
Best for: Winback campaign development, understanding customer lifecycle
Content & Messaging
What language resonates with our target users?
Why it matters
Speaking your users’ language builds trust and comprehension. Using internal jargon creates barriers.
Research approach
Card sorting + user interviews
Timeline
- 7-10 days
What you’ll learn
- What terms users naturally use for features and concepts
- How users categorize and group functionality
- What language creates confusion vs. clarity
- Differences in terminology across user segments
Real example
For IDX’s transition from B2B to B2C, user research revealed that potential customers needed to trust the company before enrolling in their privacy protection service. Remote user testing showed what prevented target audiences from converting: lack of trust builders, unclear expectations about how their sensitive information would be handled, and difficulty finding resources for early-stage research. By addressing these specific barriers with member quotes, security assurances, and easier access to educational content, IDX saw homepage enrollment increase by 20.37%.
Best for: Navigation naming, marketing messaging, feature labeling
Which value propositions matter most?
Why it matters
You can’t emphasize everything. Knowing what drives decisions helps you focus messaging.
Research approach
MaxDiff analysis or prioritization survey
Timeline
- 7-10 days
What you’ll learn
- Relative importance of different benefits
- What separates nice to have from must have
- Which messages to lead with vs. mention secondarily
- Differences across user segments
Real example
We used MaxDiff analysis to rank trust signals (customer count, certifications, case studies, etc.) for a B2B SaaS company, creating a clear hierarchy for homepage messaging.
Best for: Homepage optimization, positioning development, sales messaging
Strategic Questions
What opportunities are we missing?
Why it matters
You can’t optimize what you don’t see. Fresh eyes reveal blind spots created by organizational familiarity.
Research approach
Comprehensive journey analysis + user research + competitive analysis
Timeline
- 15-20 days
What you’ll learn
- Pain points you’ve normalized but users haven’t
- Opportunities competitors are capitalizing on
- Gaps between user needs and current offerings
- Quick wins vs. strategic investments
Real example
Our end-to-end analysis of Adobe’s customer journey from registration through cancellation to winback revealed opportunities at each stage that internal teams were too close to see.
Best for: Strategic planning, quarterly/annual roadmapping
Which user segments should we prioritize?
Why it matters
Different users have different needs, values, and lifetime value. Optimizing for the wrong segment wastes resources.
Research approach
User segmentation study (survey + behavioral analysis)
Timeline
- 15-20 days
What you’ll learn
- Meaningful differences between user groups
- Which segments have highest value/potential
- How needs vary across segments
- What each segment cares about most
Real example
We segmented users for an online shipping company by use case (personal vs. business shippers) and frequency, revealing that businesses cared most about saving money and rates, while adding account customization to their priorities.
Best For: Strategic planning, resource allocation, personalization strategies
Is this market opportunity worth pursuing?
Why it matters
Before investing in a new market, feature, or product, you need to validate demand and understand requirements.
Research approach
Market research + user interviews + competitive analysis
Timeline
- 15-25 days
What you’ll learn
- Whether the problem is significant enough to pay for
- How users currently solve the problem
- What barriers to adoption exist
- Competitive landscape and differentiation opportunities
- Required features vs. nice-to-haves
Real example
Our research into productivity tool trends revealed strategic shifts (like Canva’s move into the collaboration space targeting PDFs) that informed a SaaS client’s competitive positioning.
Best for: New product development, market entry decisions, M&A evaluation
Choosing the right approach
Still not sure which research method fits your needs? Consider these factors:
Risk level
- High risk (major redesigns, new products): Comprehensive research across multiple methods
- Medium risk (feature changes, messaging updates): Focused studies with 7-15 day timelines
- Low risk (incremental optimization): Rapid testing with 2-4 day turnaround
Timeline pressure
- Need answers this week: Rapid preference testing, first-click testing, competitive analysis
- Can wait 1-2 weeks: User testing, surveys, prototype testing
- Strategic planning timeline: Comprehensive research, segmentation studies, market analysis
Budget constraints
- Lean budget: Rapid testing, competitive analysis, analytics review
- Moderate budget: User testing, journey analysis, surveys
- Strategic investment: Comprehensive studies, segmentation research, longitudinal studies
Confidence required
- High confidence needed: Multiple research methods, larger sample sizes, comprehensive analysis
- Directional guidance sufficient: Single method, smaller samples, rapid turnaround
Answering your business questions with the right research methods
The right research approach depends on your specific situation, but here’s how to begin:
- Start with the business question, not the research method. What decision are you trying to make?
- Consider what you already know. Sometimes existing analytics or customer feedback can narrow your focus before conducting new research.
- Think about timeline vs. risk. Higher-stakes decisions justify longer research timelines.
- Don’t let perfect be the enemy of good. Rapid testing that gives you 80% confidence in 3 days is better than comprehensive research that misses your decision deadline.
- Plan to iterate. Research often reveals new questions. That’s expected and valuable.
Need help determining the right approach for your specific challenge?
At The Good, we’ve conducted hundreds of research studies across the full customer lifecycle. Whether you need rapid answers to make decisions quickly or comprehensive research to guide strategic planning, we bring 16+ years of experience helping companies turn questions into actionable insights.
Our research team can help you design a study that fits your timeline, budget, and risk level. Get in touch to discuss your research needs.
About the Author
Jon MacDonald
Jon MacDonald is founder and President of The Good, a digital experience optimization firm that has achieved results for some of the largest companies including Adobe, Nike, Xerox, Verizon, Intel and more. Jon regularly contributes to publications like Entrepreneur and Inc.