
Beyond Vanity Metrics: Understanding the Depth of Ecommerce Conversion Optimization
True ecommerce conversion optimization goes far beyond surface level tweaks and simple A/B tests. It involves thorough data analysis, identifying strategic areas for improvement, testing hypotheses, and iteration for compounding growth.
What comes to your mind when you think about ecommerce conversion optimization?
You’ve probably heard it described in terms of changing button colors, mixing up calls to action, testing headlines and copy for 24 hours, and other small tweaks. And while these things are certainly part of optimization, they barely scratch the surface. It’s like describing the workings of a car engine in terms of spark plugs. It’s accurate, but also a massive oversimplification.
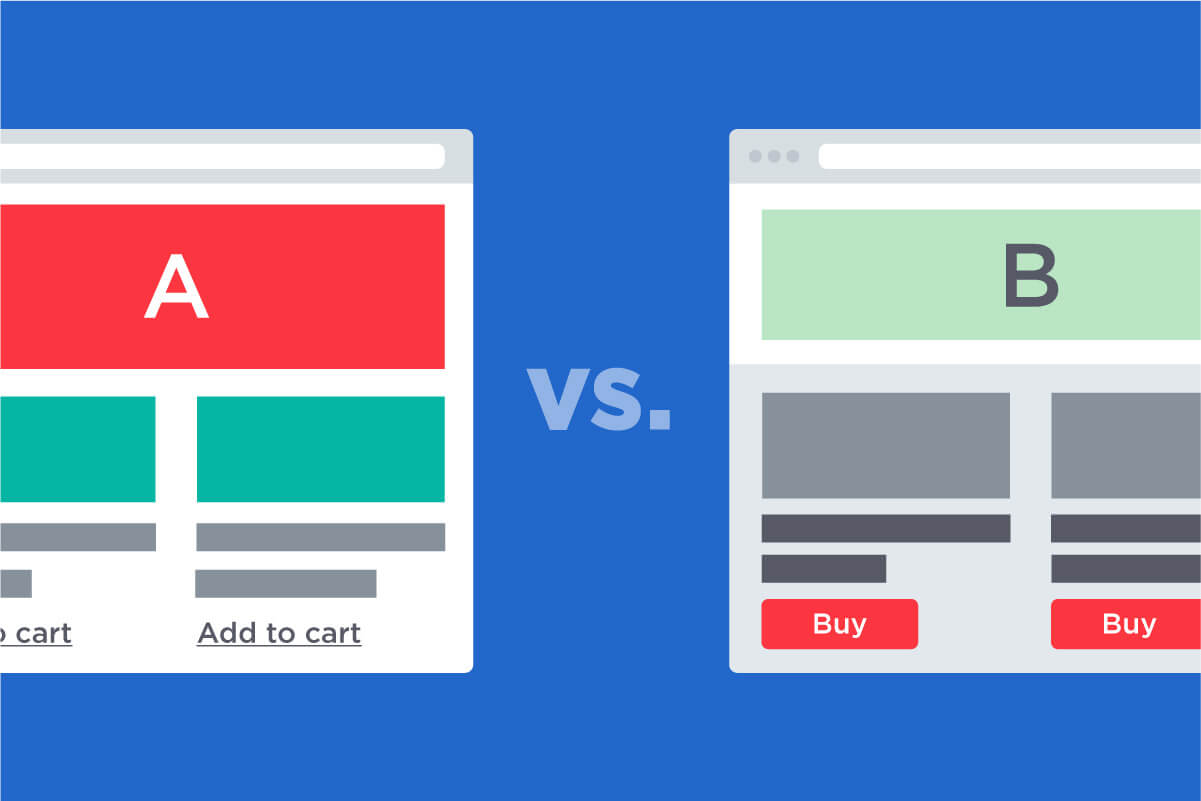
To start, you need to recognize that conversion optimization massively differs by company.
Your users are going to vary significantly depending on your industry and target demographic. Men between the ages of 18-25 purchasing Crossfit equipment are going to interact with a website much differently than a middle aged woman purchasing beauty supplies. If you sell clothing, your optimization practices need to be nuanced differently than a sports equipment ecommerce site.
As Dan Barker notes:
“A first-time visitor to your site who has never bought from you before, is far, far less likely to purchase than an old, loyal customer. On the opposite side of that, a very loyal customer & regular visitor is far less likely to be swayed to make a purchase because of little conversion tweaks.
Lumping those 2 groups together is like lumping “first time house buyers” into a big pot with “castle owners” & trying to make sense of the strange “average house price” that throws up.
Visitors from different traffic sources / referrers will also differ wildly. Direct visitors will tend to convert more highly still since they tend to contain more existing customers. Likewise brand and non-brand search terms, generic vs long tail terms will vary too.”
In other words, best practices are helpful, but far from sufficient.
Best practices are helpful, but far from sufficient. Share on XConversion optimization is a holistic, thorough process that involves optimizing your entire website for sales, based on your data, target demographics, conversion goals, and more.
This goes far beyond a simple tune up.
To do it correctly, you need to do a deep dive into your data, understanding who your consumers are, what they want, what stops them from purchasing, and what changes you can make to eliminate friction points. In order to get to your goal, you need to first understand where you are. Only then can you take the proper steps.
You also need to determine which metrics matter the most. Which levers generate the most growth and sales?
Finally, you need to be able to form hypotheses, thoroughly test them, and then iterate. Optimization relies on testing, not on guessing which change will make the most difference.
Optimization relies on testing, not on guessing which change will make the most difference. Share on XThis is a complex task, but it results in a thoroughly optimized website that is perfectly tailored for your customers and industry. If you don’t use this process, you’re essentially firing without aiming.
So how do you make this optimization process a reality? How can you go beyond colors and buttons and headlines? There are three primary steps, with a number of crucial substeps within each. It starts with understanding your consumers, moves to identifying areas for improvement, and then concludes with designing experiments around key metrics.
Understanding Your Consumers
To state the obvious, not all consumers are equal. Some will be high-revenue, while others will be nothing more than tire kickers. Optimization starts with fully understanding your target customers, which then allows you to tailor your site toward them. Getting a firm grasp on your ideal customer starts with gathering all the relevant data about who is visiting your site, what they’re doing on your site, which demographics are generating the most revenue, and more. It includes studying your quantitative data like conversion focused analytics as well as qualitative data like user testing, heatmaps, and surveys. Let’s take a closer look at each of them.
Conversion Focused Analytics
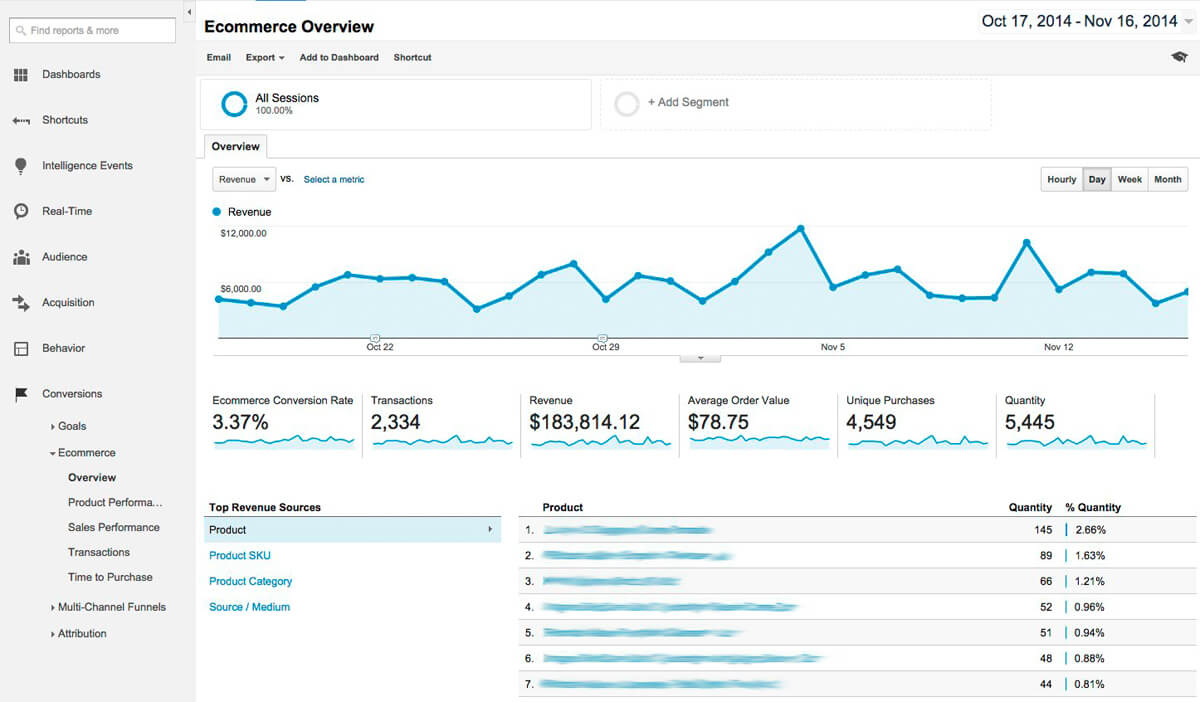
Analytics give you a broad picture of your website visitors. They allow you to determine your high growth levers, like your overall traffic levels, your conversion rate on different pages, and your average order value. They also allow you to determine your cost per acquisition, customer return rate, customer retention rate, and other crucial measurements. Often times, marketers fall victim to using the out-of-the-box reports from popular tools like Google Analytics.
Unfortunately, these default reports provide little more than vanity metrics. Those vanity metrics might be great for tuning your marketing, but not for improving your conversion rate. Your reports and analytics need to be tailored to your business goals and key conversion levers, not generic reports. Once you learn to manipulate these levers, you can then increase your overall ecommerce revenue. You can also see which pages are pulling in the most traffic, which pages are getting the most return visits, how long customers are staying on pages, various bounce rates, where you’re losing your customers, and page load time.
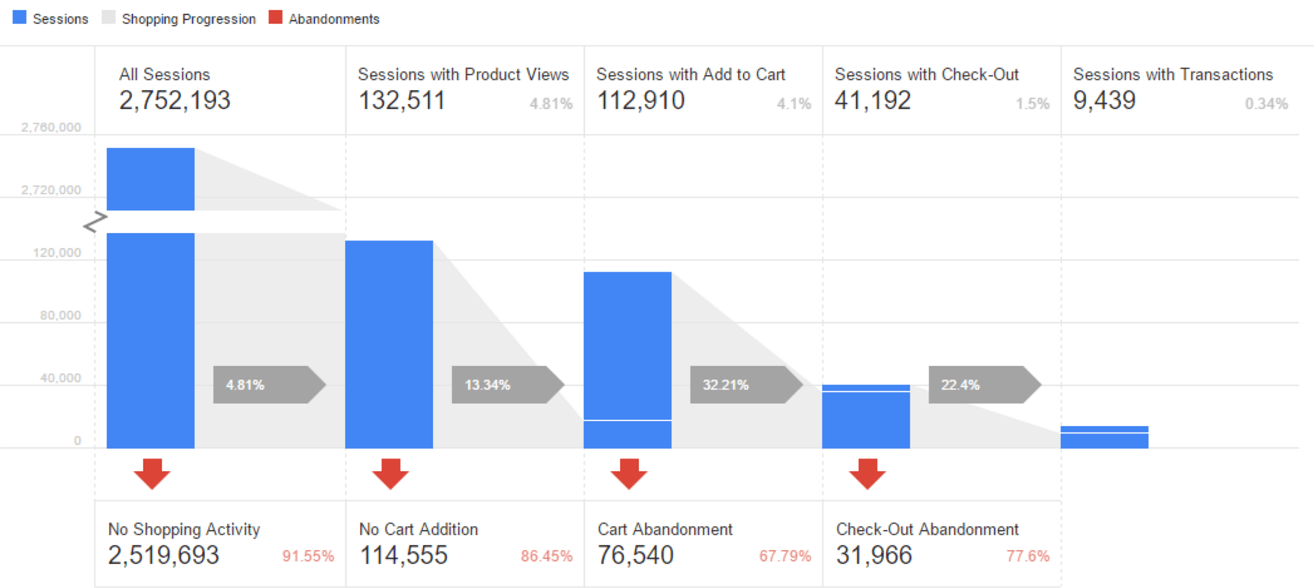
Knowing your most valuable pages allows you to later identify your high impact areas. Analytics allow you to analyze visitor flow through your site. You can see where “loops” are occurring. A loop is when a visitor keeps flipping back and forth between two pages, like the home page and a product page. This indicates confusion and shows you where improvements can be made. Additionally, it can open your eyes to places on your site where you’re essentially leaving revenue on the table.
You can also evaluate key conversion rates. Which demographics are generating the most revenue? Which copy and headlines are converting most effectively? Are certain countries outperforming others? What about times of day? If your conversion rates for key demographics are low, it indicates you’ve got some serious room for improvement. With analytics you can examine your various channels and traffic sources for effectiveness. Does social media or organic search traffic produce more sales? What about Facebook ads vs. Google ads? How well is your email marketing converting?
By seeing which channels are producing conversions and which aren’t, you can evaluate and change your strategy in those channels. These, as well as dozens of other analytics, will give you a broad picture of what is happening on your site. It will also allow you to see sticking points, friction areas, and places where visitors are abandoning the site. It’s not enough to simply look at analytics averages. You need to dig deeply, identifying the true causes of surges and drop offs. As Dallas McLaughlin says:
Enjoying this article?
Subscribe to our newsletter, Good Question, to get insights like this sent straight to your inbox every week.
“…knowing your traffic sources can reveal only so much. Whereas, understanding who your visitors are and what their intent is can be game-changing. In fact, I would say it’s crucial to the success of your company. When you know who your visitors are and what their intent is, you can tailor your site content to reflect their interests. This will result in higher conversion rates and a better return on your marketing budget because you’ll be making better use of your website traffic.”
User Testing
It’s been said that a website should be usable for someone who’s thoroughly drunk. And while this is an oversimplification, it gets to the issue of user testing. User testing is crucial for tracking visitor behavior within your site. It lets you see exactly how your customers are moving through your website. It shows where your visitors are getting lost or stuck, as well as how they navigate through your site. It reveals whether navigation is simple or contains unexpectedly confusing elements.
By working with users, you get to see through their eyes. You can identify category overlap, checkout inefficiencies, unclear product pages, and other issues you would miss on your own. When you spend every day on your site, it seems easy to understand and navigate. You’ve designed it, after all, and know exactly how it’s supposed to work. User testing shows what the experience is like for an unfamiliar visitor. It reveals whether your site is really as user friendly as you believe.
Heat Mapping, Scroll Mapping and Click Mapping

Heat maps are all about determining how and where your visitors are moving and clicking. Are they clicking on unexpected locations? Are they losing interest at certain points? Are your visitors engaging where you want them to? Are you putting your most important content in your most engaging spots? Is your email opt-in getting the exposure it needs? You may think your sales banner beneath the fold will generate increased sales.
On the contrary, most heatmap testing shows that content below the fold gets far less attention than content above the fold. People give 80% of their attention to content above the fold and only 20% to everything else. You may think that the left side and right of the page have equal value when heatmap studies show that 69% of attention goes to the left side. Turns out intuition is often wrong. Heat maps can reveal your false assumptions and gut feelings, showing you what is really happening on your site.
Surveys
One of the simplest, most effective ways to determine what your visitors want and what problems they’re encountering is to simply ask. Asking your visitors for their opinion and then evaluating the themes and trends that emerge can give you an idea of whether you’re really addressing the relevant pain points. It can also reveal unexpected trends about what really matters to those visiting your site. Finally, it can help you create customer personas around specific data.
Additionally, when using surveys in conjunction with analytics, you can target specific segments of your customers, like churned customers, prospective customers, and engaged customers. Finally, surveys allow you to take phrases directly from visitors and put them straight into your copy. This allows your copy to resonate much more with customers because it’s in their own voice. Discussing customer surveys, Jennifer Havice says:
“I’m talking about little nuggets of insight straight from your customers’ mouths. These are pieces of information that inform your copy so you can do all those things like address their concerns and provide the ideal amount of detail to your argument depending on how aware they are or not of your solution.”
More Context
Can you see how gathering this amount of data give your far more context and nuance than simply evaluating buttons colors, headlines, and calls to action? You need wide swaths of data to make informed decisions. Otherwise, you’re still just guessing. When you analyze things on a surface level, it can be difficult to determine why certain things actually work. Why did one headline outperform another? Was it the word choice or did it touch closer to the pain points? Did one button outperform another because of its location on the site, a change in the traffic source, or the page load time? Without gathering large amounts of specific data, it’s impossible to tell what changes truly optimize your site and which are just lucky guesses.
Identifying Strategic High Impact Areas For Improvement
Once you’ve gathered all the data, you need to determine which areas and metrics matter the most. You don’t want to simply start at the top of your list and check things off one at a time. You need to determine which changes will have the greatest impact and generate the most revenue. You’re looking for exponential results. Ask yourself these questions:
- If I changed this metric, how significant would the results be tomorrow? It’s one thing to improve a metric, like bounce rate. But if it doesn’t generate significant results, it’s not a high impact area.
- Will improving this metric contribute to our actual goals? Improvement for its own sake isn’t enough. You can easily increase traffic without seeing an uptick in sales. You need to determine which metrics will make the biggest dent in your goals.
- Is this a metric that will also improve other metrics? Many metrics are interconnected, and improving one can create a domino effect. For example, identifying key traffic channels can improve the quality of your traffic, which can then increase conversions.
- How sure am I about this metric? Do the analytics sufficiently support this confidence?
You may even want to create a score for each answer to help you determine which metrics are most valuable. For example, on a scale of 1-10, if you think a change would have a big impact, it could be rated as an 8. After answering all the questions, you add the scores up to get a cumulative answer which can be compared against other metrics.
Creating this kind of scale can make the process even more objective. It can be tempting to focus on the vanity metrics, like traffic or increasing social shares on content, but vanity metrics rarely are the most impactful. Every metric is a lever. Pulling on some will generate large amounts of growth, while others will barely move the needle. You need to determine which ones truly matter and which are only about padding your ego. Remember, you’re after conversions, not just a boost in traffic or reduction in bounce time. The 80/20 rule applies to optimization as well. 80% of your growth will come from finding and optimizing 20% of the metrics. You want to start with the most powerful ones and move down the list from there.
Designing Experiments Around Key Metrics
Once you’ve identified the high impact areas, you can begin imagining, crafting, and testing solutions that focus on your key metrics. The temptation is to immediately make changes and then push them. After all, if you think the changes will generate positive results, you want to get them out there as soon as possible. But this is shortchanging yourself. You may see an uptick in results, but not the kinds of gains you’d see if you spent time creating and testing hypotheses.
Deploying User Tests
A better solution is to deploy user tests around key, high impact problem areas. User tests call upon real people who match your target customer profile to browse your site and follow a series of instructions. The testers we deploy at The Good have been trained to think out loud so you are able to get a look at their consumer experience and their thought process as well.
For example, let’s say your analytics reveal that customers are getting confused when they visit particular product pages and then try to check out. By doing a user test on those pages, you can experience what it’s like for them to try to navigate what seems very clear to you. As they run into problems, you can note those problems for changes. This gives you a lot more insight into the problem than simply guessing. You can create hypotheses based on actual user experience rather than blindly trying to figure out why problems exist.
Testing Your Hypotheses
Once you’ve formed your hypotheses about how to fix the problem, you can make the change and then begin testing. One simple way to test is to automatically show these changes to half of your visitors, do an analysis, and then determine whether the hypotheses was proved true. Once the test is done, you can make a second change, test again, and so on. This iterative process allows you make incremental changes in a positive direction.
It should be noted here that you’re going to need a minimum amount of site traffic to reach statistical significance with your test. If you’re a low traffic site, it’s going to take longer to make valid conclusions than it would with a high volume of traffic. This is why many conversion rate optimization firms require a minimum traffic volume. This type of testing takes guesses, gut feelings, and intuition out of the optimization process. The changes are made based on hard data and winners are only selected when statistical significance, a way of mathematically proving that a specific statistic is reliable, is reached.
Iterating The Process
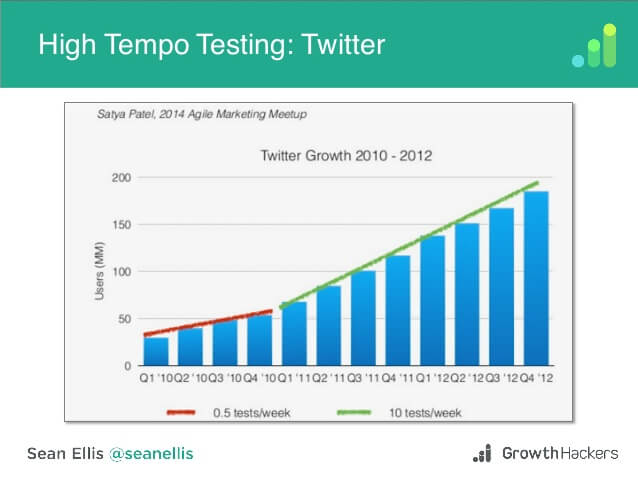
So how do you fit all these pieces together? How do you truly optimize your site for maximum ecommerce revenue? The final step is to develop a cadence and tempo to your testing. You’ve identified your key target audience and problem areas, and know how to iteratively test your hypotheses. The only thing that’s left is to develop a steady rhythm for this testing. Twitter’s rapid growth between 2010 – 2012 was largely due to their aggressive, high-tempo testing. During that period, they cranked their testing velocity from 0.5 tests per week all the way up to 10. As Morgan Brown notes:
“The tests that they were doing wasn’t anything crazy. It’s tests that all of you as optimizers in here would recognize as familiar. They did many homepage tests, they also did things like fix form validation errors in non-western language countries that led to massive gains. All basic conversion optimization things. The difference is that at such a scale and without people really noticing it, people turn around and say, ‘Wow, Twitter is growing like crazy. They’re growth hacking.’ Well, no, they just massively increased the velocity of their tests.”
GrowthHackers did the same, nearly doubling their monthly active users thanks to a massive increase in the speed of their iterative testing. As Sean Ellis notes:
“We grew from 90,000 MAU [monthly active users] to 152,000 MAU in about eleven weeks without spending a dollar on advertising or increasing the size of our growth team. The only thing that changed was the velocity of our experimentation. We achieved that velocity improvement by adopting the high tempo testing framework to help us prioritize and close the loop on the growth experiments that we thought would move the needle.”
Running a few iterative tests can certainly improve the conversion optimization of your site, but upping the tempo and consistency of those tests can truly move the needle. One essential part of this process is recording and archiving all results. This keeps you from repeating tests, allows you to communicate wins to your team, and enables you to continuously improve the quality of your tests. The more tests you’re running, the more crucial it is to keep a good record of the results.
The Beauty of Compound Growth
This cycle of analyzing, identifying, experimenting, and iterating creates a beautiful cycle that compounds upon itself. The first round produces growth, the second round produces exponentially more growth, and so on. It’s like interest on a bank account. The initial results may seem insignificant, laughably small even. But the more iterations you cycle through, the greater the impact. Pretty soon, you’re seeing massive growth that can transform your company. You’re reaching levels of ecommerce optimization you previously thought untouchable. True conversion optimization is not simple or quick. There are no shortcuts. But if you’re willing to do the work, you’ll see the results.