The Poetry of User Flow: The Straight Path to ROI
Learn how to identify the main pathway your visitors take to purchase from you and how to encourage visitors to take your preferred customer journey.
“Two roads diverged in a wood,” says the poem, “and I – I took the one less traveled by, and that has made all the difference.”
But… what does poetry have to do with user flow and conversion optimization, you ask?
Plenty.
Visitors to your website are in the same predicament as Frost’s traveler. They must choose which path to follow. One path leads to a happy conclusion (the sale), but the other can mire them down in confusion and regret.
In this article, we’re going to talk about the buyer’s journey on your site. Specifically, we’ll point out these three things:
- We’ll show you how to get a look at your current user flow paths
- We’ll show you how to identify the main trail (every website has one)
- We’ll show you how to encourage visitors to take the preferred customer journey
The bottom line: We’ll help you optimize your path to purchase and get more sales.
The User Path: What it Is and Why It Matters
Have you ever seen an off-road vehicle area that’s unregulated? Tracks and roads run off in all directions. Once you’re in very far, it’s easy to get lost and end up driving around in circles. That can be downright scary.
Compare that to an interstate highway. Signs along the way keep you up-to-date on where you are and where you can go from there. You’re in control of your destination. Life is good.
Poorly planned websites are like the off-road example. It’s easy to get lost in there, and getting to somewhere specific can take a long time. User flow is haphazard and unpredictable.
Optimized sites are the superhighways of the internet. They keep visitors informed and in control. They’re simple to navigate and a joy to travel. User flow is obvious and extremely predictable.
Optimized sites keep visitors informed and in control. #ux #cro Share on XUser flow is evidenced by the paths users take on their journey. On an ecommerce website, that might be product search, product review, product purchase. You must know two things:
- What path do you want visitors to take on your website?
- What path are they currently taking?
If those two paths are identical, you’re shipping product. If they aren’t, you’re missing sales… maybe plenty of sales.
Optimized user flow leads to improved user experience (UX), and user experience is a huge part of search engine optimization (SEO) today. Some say extraordinary UX is the best SEO. We’re inclined to agree.
Here is the essence of the formula just described:
- User flow optimization improves user experience
- User experience optimization boosts sales and SEO
- User path to purchase and user flow work together
Are you convinced of the need for a customer journey map that identifies and describes user flow as a necessity in ecommerce?
Good.
Let’s look at how you can view user flow on your site right now.
Learning Point: How Digital Desire Paths Lead to Better Website Design
How to Identify User Flow on Your Ecommerce Website
User flow identification requires analytics, so we’ll use Google Analytics (the tool that’s captured over 80% of market share) to describe the process of user flow identification.
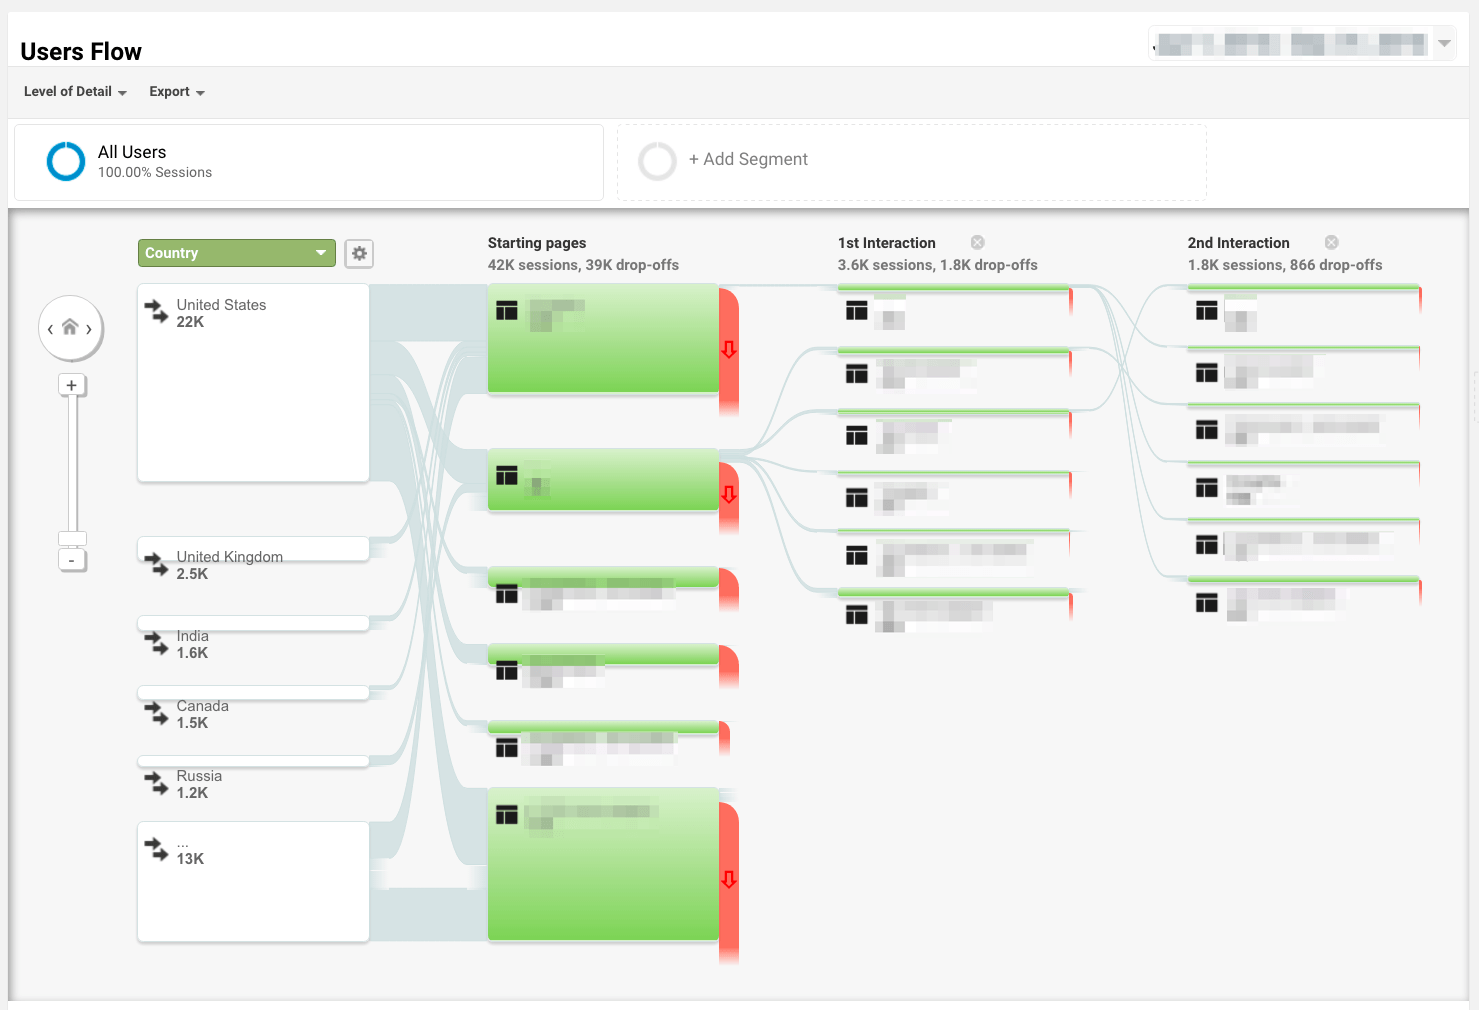
Access the Users Flow report for a visual look at your customer experience journey
Our model is based on the excellent tutorial on the topic by Andy Crestiodina. If you’re not using Google Analytics currently, you can get a fully-featured version free. Refer to the Google Help article on the topic.
- Log in to Google Analytics
- Choose the website property you want to evaluate
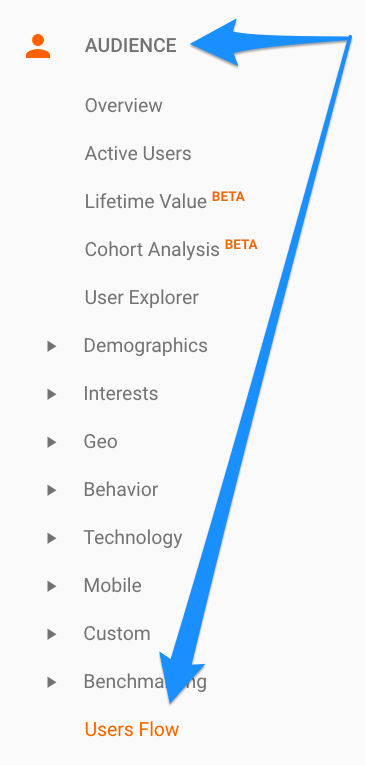
- Look under the AUDIENCE section and click on Users Flow

Yes, it’s that simple to get a look at user flow on your ecommerce site.
Understanding what you’re looking at, of course, may require learning a little about Google Analytics – plus, there are other reports to explore – but this is an excellent starting point.

We find that clients are often amazed at how much information has been waiting for them. It’s like getting an unexpected Christmas gift.
Here are a few pertinent points about the Users Flow report from Google Analytics:
Enjoying this article?
Subscribe to our newsletter, Good Question, to get insights like this sent straight to your inbox every week.
- Traffic moves from left to right
- The first column on the left provides information about the source of traffic
- The second column from the left identifies the starting (landing) page (in green)
- The third column from the left reveals the first interaction, and subsequent columns show you additional interactions
- The “Add Segment” button on the top left allows you to define the sources you want to consider
- Clicking on a box will allow you to explore traffic at that point more deeply
- You can dial in the dates you want to view via the date range selector in the upper right
- The red downward funnels show you the drop-off rate from that point
The Users Flow report will quickly reveal where your traffic is coming from, how landing pages rank in popularity with your visitors, how many choose to go deeper, and where they go when they do.
Learning Point: How does the revealed user path (customer journey map) compare to the path to purchase you want your visitors to take?
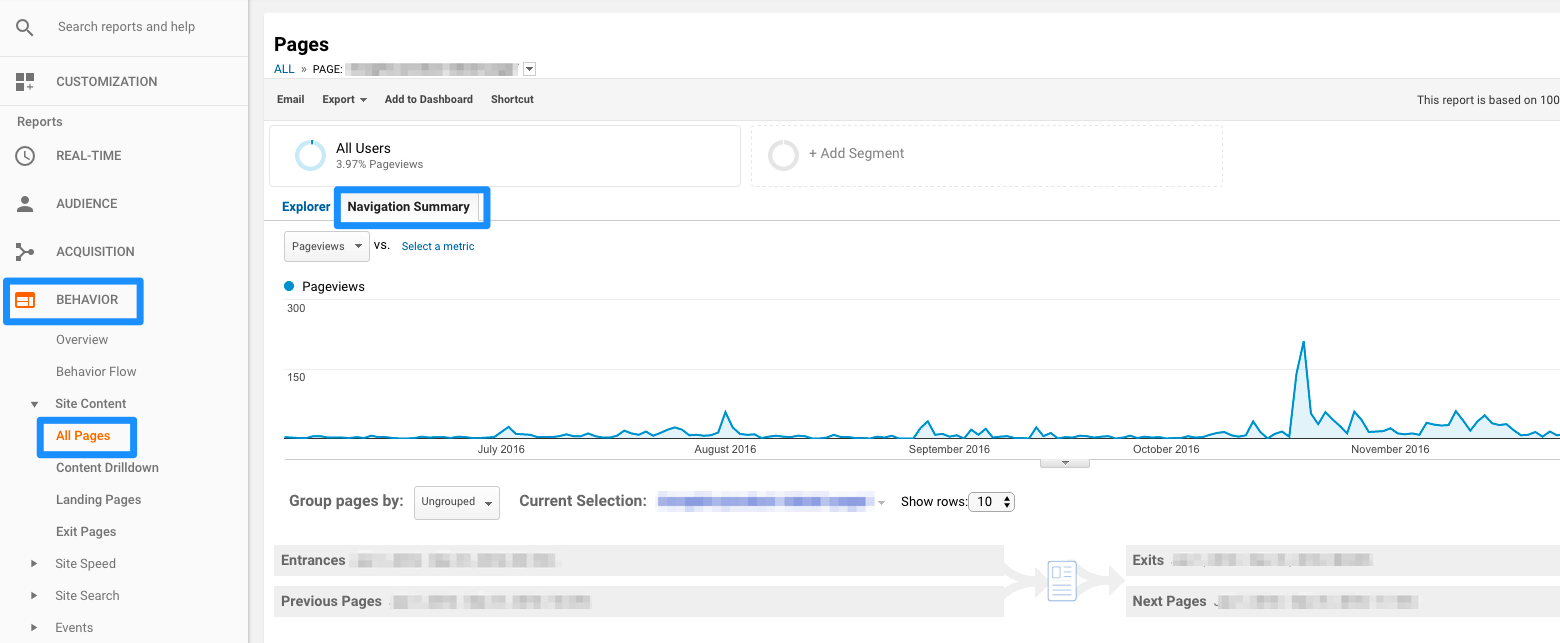
Access the Navigation Summary report to see the user flow for each page
You can drill down to get a closer look at user behavior on each page. The Navigation Summary shows percent exit, average time on page, bounce rate, pageviews, and unique pageviews. A little time invested in learning how to interpret the data here can pay off big in your understanding of how users are navigating your ecommerce website.
- Select the account you want to explore and click View
- Find the BEHAVIOR heading in the column along the left
- Find Site Content and click the arrow on the left
- Choose All Pages
- Click on the page (left column) you want to know more about
- Choose the Navigation Summary tab in the header

Note that you can add segments for this report. That function allows you to view your audience by differences in demographics, technology used, behaviour, date of first session, traffic sources, ecommerce transactions, and more (advanced).
If you’re not hopping up and down with excitement after discovering how much valuable data you’ve been ignoring, then you’re already checking these reports or you’re not following along as we describe them here.
Do you want a breakdown of pages according to their popularity with certain age groups? Do you want to know how many visitors arrived on your site by using a certain keyword? Are you interested in how much time has elapsed between the time you ran a certain campaign and the purchases resulting from it?
You can find all of that – and a whole lot more – in the Navigation Summary reports.
Use your Google Analytics goals to get a graphical report of your sales funnel
You must set up analytics goals before you can utilize this feature. If you’ve yet to do that for your site, this will give you an excellent reason to do it. Here’s where to get started: set your user behavior goals.
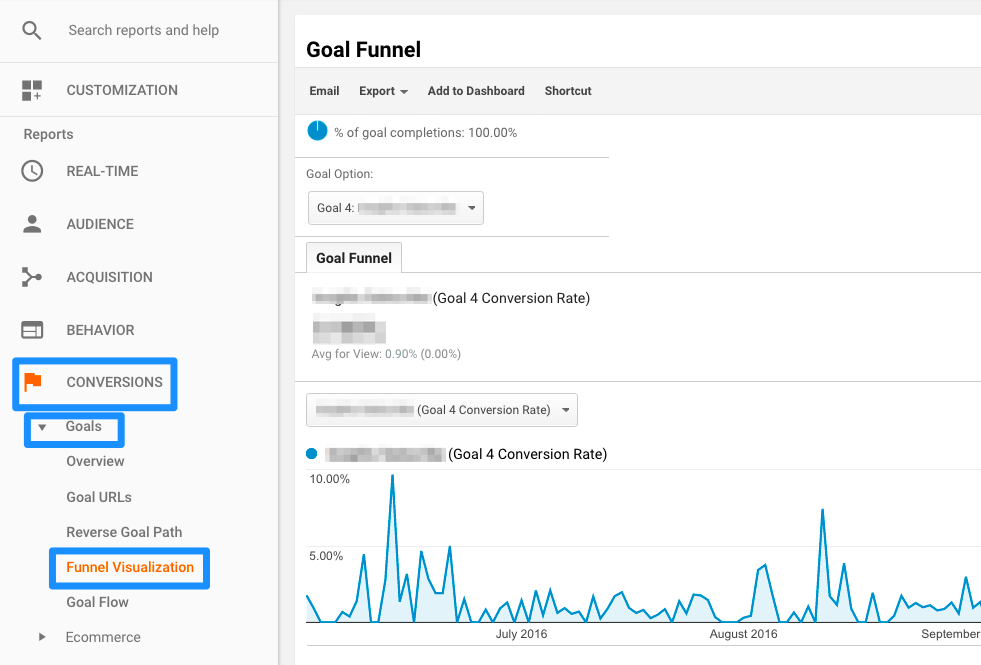
The Funnel Visualization report will show you each step along the final path to purchase, and it will help you identify the stuck points causing prospects to drop off before final checkout. Not only that, but it will reveal where those prospects go when they abandon their cart.
Here’s how to access Funnel Visualization:
- Open up the account you want to explore
- Click on CONVERSIONS in the Reports column on the left
- Click on the arrow to the left of Goals
- Click on Funnel Visualization

Remember, it’s necessary to set up Google Analytics goals first. This report will provide a wealth of information on where user flow is abundant and where it is restricted. It will give you picture of where your funnel is leaking.
Those three reports aren’t the only way you can view your user paths, but they’re all you need to get a good look at those paths.
Two of our goals for this article will have been accomplished once you’ve followed the steps outlined above:
- The main user path will be obvious
- The secondary user paths will be obvious
One question remains: is this the user flow you want for your site, or does it need adjusted? And if you find adjustment is desired, a bigger question appears: How can I change the user flow?
Let’s conclude this discussion by considering that question.
Learning Point: Google Analytics Training and Support
How to get visitors to follow the path to purchase
Think back to the example of unregulated off-road vehicle trails versus interstate highways. The first is chaotic. It’s easy to get confused and lost.
The second is well-defined. It would be difficult to deviate from the path. You can make choices (take the exit or don’t, pull off at the rest stop or don’t), but every choice leads to desired outcome. There are few surprises when you’re traveling on the interstate.
The same principles apply to your ecommerce website. Provide guardrails for your visitors and they’ll stick to the user path you set forth. You can combine your prospects’ desire for an excellent user experience with your desire for maximum sales… and reap SEO benefits to boot.
Here’s how:
- Identify the best possible path from every page on your site to the final checkout page
- Design each page to support that path
- Implement, test, and continue to refine that journey
It sounds simple, because it is simple.
That doesn’t mean it’s easy, though.
If you need help along the way, The Good can step right in beside you. Our services are all designed to drive conversions and online sales.
Don’t settle for lackluster ecommerce performance. Guide the user flow, provide a world-class customer experience journey, and light up the path to purchase so well even the most harried traveller can’t get lost.
Save surprise destinations for poems and their critics. Your visitors want to know where they’re headed and how to get there.
Show them.
Enjoying this article?
Subscribe to our newsletter, Good Question, to get insights like this sent straight to your inbox every week.
About the Author
Jon MacDonald
Jon MacDonald is founder and President of The Good, a digital experience optimization firm that has achieved results for some of the largest companies including Adobe, Nike, Xerox, Verizon, Intel and more. Jon regularly contributes to publications like Entrepreneur and Inc.