Key Google Dashboards to Make Your Analytics Actionable
The complexity of Google Analytics often prevents people from using it to its full potential. Dashboards for Google Analytics provides brand leaders with an easy way to begin to more fully leverage this valuable tool.
It’s no secret that Google Analytics can provide brand leaders with a wealth of knowledge about their websites. But the sheer size and complexity of Google Analytics is often enough to scare people from using it to its full potential. The good news is, Google Analytics can easily be tamed if you know where to start – Google Dashboards.
What are Google Dashboards?
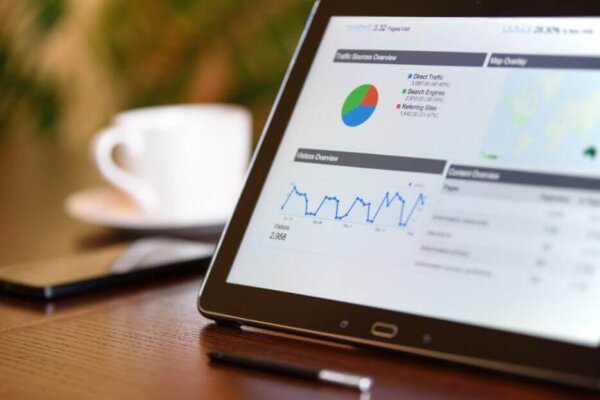
A Google Dashboard is a summary of important metrics within Google Analytics that enables you to check your site’s performance at a glance.
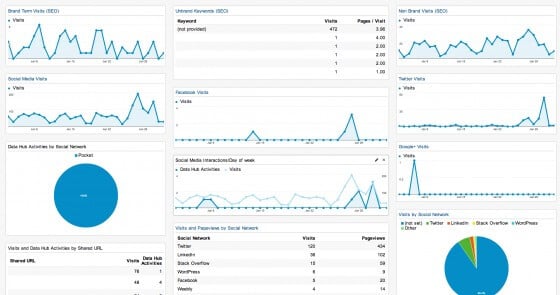
This brand monitoring Dashboard example (above) shows how your site is performing with branded and non-branded terms (SEO), social media, and brand term traffic (non paid).
The Dashboard is divided into two sections: SEO and Social. Each section is composed of widgets. Widgets are the rectangles with the graphs or tables. Each widget can be opened to reveal a more detailed report. With this Dashboard, you can quickly see how your brand is performing across multiple channels without diving into the weeds of the larger reports.
To help get you started with Dashboards, we have created a custom Dashboard where you can see your site’s performance on social media and search. Once set up, the Dashboard will provide you with data specific to your brand’s site.
IMPORTANT: This information and any information about your brand’s Google Analytics account is entirely private and is not, in any way, available to any person (including The Good) who does not have access to your Google Analytics account.
How to setup your custom brand monitoring Google Dashboard
- Click to use our brand monitoring Dashboard.
- Sign into Google Analytics
- Choose the “View” (The site you want to monitor)
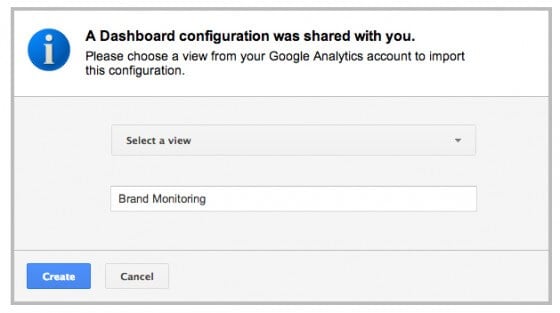
- We’ve named this Dashboard “Brand Monitoring,” you can name it anything you like.
- Click “Create” to add the Dashboard to your profile
Your new brand monitoring dashboard should populate with data from Google Analytics. To finish customizing your dashboard, follow these steps:
- To see traffic from customers searching specifically for your brand:
- Click on the pencil icon on the Brand Term Visits (SEO) widget

- Add your brand’s name in the box under “Filter This Data” where it says “brand name”
- Click “Save”
- Click on the pencil icon on the Brand Term Visits (SEO) widget
- To see top unbranded keywords that drive traffic to your site through organic search:
- Click on the pencil icon on the Unbanded Keywords (SEO) widget
- Add your brand’s name in the box under “Filter This Data” where it says “brand name”
- Click “Save”
- To see traffic from customers who visited your site without searching for your specific brand (i.e. typed in keyword rather than your brand name):
- Click on the pencil icon on the Non Brand Term Visits (SEO) widget
- Add your brand’s name in the box under “Filter This Data” where it says “brand name”
- Click “Save”

Why you should start with this Dashboard
This particular Dashboard provides you with the greatest amount of immediate information about your brand’s site in one easily digestible page.
There are two especially important sections of this Dashboard – SEO Traffic and Social Media Visits.
- SEO Traffic: This category will show how well customers are finding your brand either by directly typing your brand’s name into search or searching for terms related to your brand.
- Social Media Visits (Facebook, Twitter, etc.): This category captures the overall strength of your brand on social media, how much your customers feel your brand is a part of their social circle, how engaged they are with your brand, and how interested they are in learning about your brand.
As with all things Google, there is a near infinite amount of customization and detail. So if you find that you’ve changed the Dashboard in a way that isn’t helpful clicking this Dashboard link will reset the Dashboard (Note: Dashboards don’t change any data) and enable you to start again with the original version of the Dashboard.
Where to go once you’re comfortable with Dashboards
There are hundreds of different Google Dashboards that you can create to look at specific areas of your brand’s website. In the coming weeks we will talk about some of the other dashboards you can use. In the meantime, here is a sample of possible ideas for creating your own custom Google Dashboards:
- PPC Analysis Dashboard – looks at the effectiveness of your PPC campaigns
- SEO Dashboard – looks at the effectiveness of your SEO campaigns
- Site Performance Dashboard – looks at the technical performance of your site
- Traffic Overview Dashboard – looks at the channels people use to access your site
- E-commerce Dashboard – looks at the revenue generated by your site
- Popular Content Dashboard – looks at the content most viewed by your customers
You can spend hours discovering the data Google Analytics collects and the different ways you can look at it. If you don’t have the time to do this or you don’t have the in house expertise that can do it, there is another option in The Good’s Conversion Growth Program™.