
How To Drive Conversions with Heatmaps
Heatmaps are only one tool in the conversion rate optimization toolbox, but for analyzing the behavior of your visitors, heatmaps lead to insights you can’t find using other methods.

Heatmap tools are powerful in website optimization and driving conversions. They give a visual representation of average user behavior by aggregating data showing where users click, move and scroll through pages. More than just a single dataset showing total numbers of actions, heatmaps add more ammunition to the empirical data arsenal.
Why Heatmaps?
Heatmaps fit rightfully into place in the big conversion testing weapons along with site analytics, live user testing, and A/B testing tools. Heatmaps may not have the breadth and variety of site analytics tools but they offer more clues to optimization by showing your site through the eyes of your users. Heatmaps also may not have the depth of live user testing but they do have greater sample sizes for aggregation and averages which can help weed out the outliers. Heatmaps and A/B testing tools are complementary, in fact, we recommend running heatmaps on our A/B tests as a standing best practice.
Trends to Look For
The key to reviewing heatmap data is to look for larger positive and negative trends. Share on X
The key to reviewing heatmap data is to look for larger positive and negative trends. Concentrations of clicks in some areas of the site may mean different things depending on the intent of the page. For example, high concentrations of clicks on a header logo is likely a sign of users looking to return to the home page – which can be good if your home page is the navigational hub but bad if users are partially through the checkout process and abandoning.
Heatmaps are run on single pages for all relevant responsive breakpoints and most commonly present data back in the form of click, scroll and movement tracking for a set of user sessions.
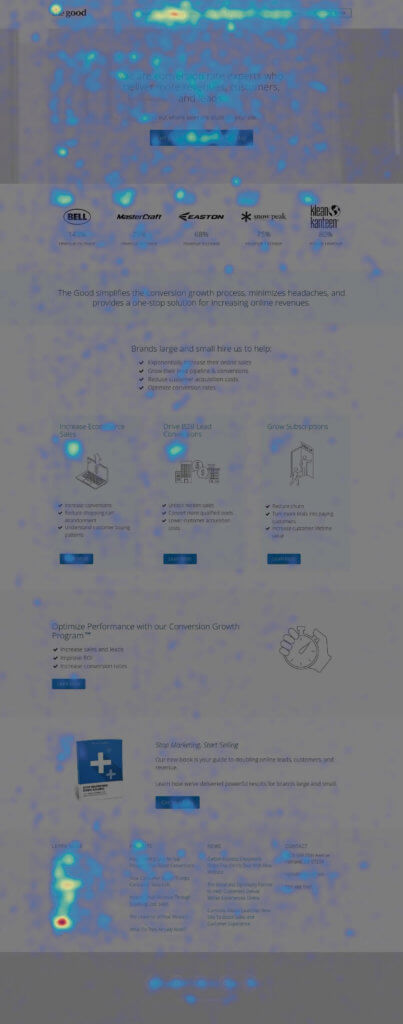
Click Tracking

NOTE: For the purposes of this Insight, we bucket “taps” (the equivalent term for clicking on mobile and tablet devices) into “clicks”, however most heatmap tools will use the appropriate term by device.
What to look for:
- Concentrations of clicks – both their presence and their absence. Here’s a quick reference guide to help you determine what to do with this heatmap data:
| High Concentration | Low Concentration | |
| Clickable Area | If this is the main call to action of your page, you’re doing something right. Investigate the success you’re seeing here and where it can be tested on other areas of the site. | If this is the main call to action of your page then revisit the visual priority and copy of the area. Apply any learnings you can from other, better performing actions on the site. Also consider running live user tests and A/B tests to diagnose the causes of the low concentration. |
| Not a Clickable Area | This is a strong indicator that the user expects an action to occur here that isn’t already occurring. Address this by providing the user with that intended action and measure the results. For example, seeing click concentrations on product logos in a comparison chart may indicate that users expect to be taken to that product’s detail page. | This is true of 99% of the heatmap and likely matches the intent you had for this area of the page. If you want to see the effectiveness of non-actionable content in this area then you may need to review scroll and move tracking to provide you with more information. For example, if measuring a text article like a blog post, you can see how many users read all the way to the bottom of the content. |
- Content prioritization – conventional wisdom from UX best practices is to put your most important content from top to bottom, left to right in an F-shaped pattern. Review the clicks in your heatmap to see if your users are following this same pattern. Are clicks occurring more on the 4th content item than the 1st content item? Consider a test placing the 4th item into the top position on the page and measure the results.
- Device patterns – look to see if your users are behaving consistently or inconsistently across different devices. There may be areas of the site that are completely ignored by mobile users that may be best served by being removed in those responsive breakpoints.
- Customer journeys – we recently uncovered a significant amount of new learnings about a client’s customer journey by taking a deep look at their heatmap data. We compared new and returning visitors on the same page and found new visitors preferred to use a guided, multi-step tool and read every page to find the right product. This is in contrast to returning visitors who prefered a direct path and very little clicking. By mapping out their customer journey to the heatmap data, we were able to recommend a new landing page layout and significantly improve conversions.
Scroll Tracking
What to look for:
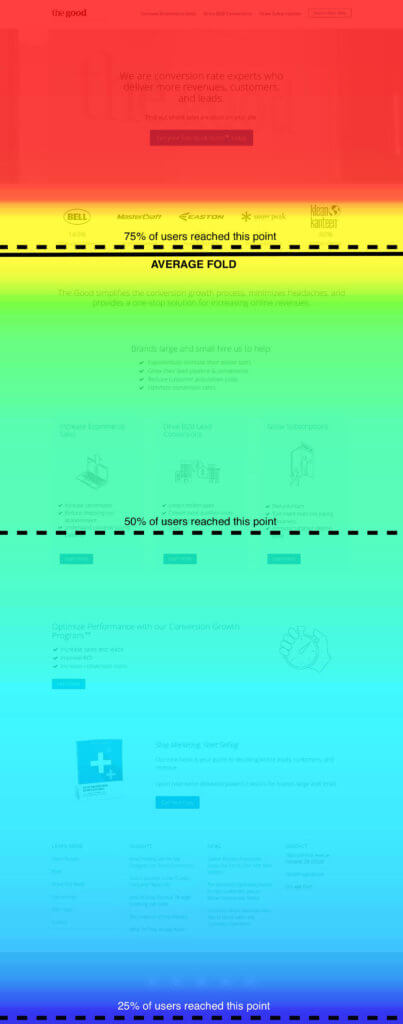
- Average fold – this statistic shows a solid line where an aggregated average browser window height ends before users scroll. This line will give an indication of where to prioritize the most important content. Recent studies have shown that users interact 84% more above the fold than below it, but your heatmaps will show you exactly how accurate that industry average is for your users. Use this data to prioritize your content accordingly.
- Quadrant (75/50/25% and Bottom of Page) lines – these statistics can be strong indicators of where your users are most focused on the page. In a recent example, an analysis on a high exit rate page for one of our clients showed that the 50% line was at the bottom of a long page, indicating that the content was effective at capturing attention but that it lacked an effective CTA at the bottom of the page. Which of your pages are also missing CTAs at this point?
- Which areas get ignored – look for key areas of the page that you want to analyze and determine the amount of traffic that reaches them. If the key areas receive less than 50% of traffic but have a good proportion of clicks on them, the problem may reside in placement rather than an ineffective CTA. Test this area out on another location on the page and measure the results.
Movement Tracking
Movement tracking can be effective at identifying areas that garner some attention from cursor movement yet may or may not also convert into a click.
Due to the variety of input devices (mouse, touchpad, touchscreens, etc.) available to deliver movement tracking data, these heatmaps are generally considered inconsistent for empirical data. These should be used in combination with the other tools to gather learnings or used as anecdotal evidence.
What to look for:
- Contrast between movement and clicks – comparing the concentration of movement to the lack of clicks on a particular element can be a strong indicator of good reading content which lacks a compelling CTA. This is a great opportunity to test copy, imagery, colors, and offers to boost clicks.
Other Heatmap Tracking Tools
Eye tracking can be a more effective way to track movement throughout a page and can be used to find insights from individual observations as well as aggregated data. Unfortunately, testing this is a larger commitment in time and resources typically requiring users to enter a formal study in a lab environment.
Session recording is an alternative method to eye tracking that can be also be effective in determining optimization tactics through movement. This is a method that records clicks, scrolls, and cursor movement for individual sessions on a page from landing to exit. These are also good to find insights from individual observations as they don’t provide aggregated data.
More Information
Here are a few of the Heatmap Tools that we use at The Good:
There are other tools available on the market such as:
At The Good our Conversion Growth Program™ utilizes tools such as heatmaps to collect qualitative and quantitative data from which we can make informed hypotheses and recommendations. And the first step towards improved conversions is obtaining a Stuck Score™. Fill out the form below to get your score today, followed by a complimentary detailed review of the findings with one of our Conversion Strategists.
About the Author
Dan Weinsoft
Dan Weinsoft is the former Director of Conversion and UX Strategy at The Good. Dan and the team at The Good made a practice of forming key strategies to boost online ecommerce and lead generation performance using testing, optimization, and data-backed insights.