5-Minute Website Assessment Based on 16+ Years of Optimization Data
Revenue Opportunities Hidden in
Wilco Farm Stores's User Experience
3 Free Data-Backed Website Optimization Opportunities
We analyzed Wilco Farm Stores's digital experience using our proprietary database of 2,000+ tests, 10,000+ research data points, proprietary frameworks, and initial research methods. Now we've identified $4.0M in potential revenue improvements.
Our Methodology

To create this analysis, we:
- Analyzed your website's user experience patterns
- Compared against 200+ similar Retail - Farm & Home Supply companies in our database
- Applied our DXO Heuristics framework
- Generated real-time heatmap data
- Cross-referenced with test results from past clients facing similar challenges
How we calculate revenue projections
Revenue projections are calculated using public estimates of your annual revenue, the conversion contribution of each page type, historical lift percentages from our database of thousands of experiments, and a confidence multiplier based on evidence strength. Total projected impact is capped at a percent of annual revenue to ensure conservative estimates.
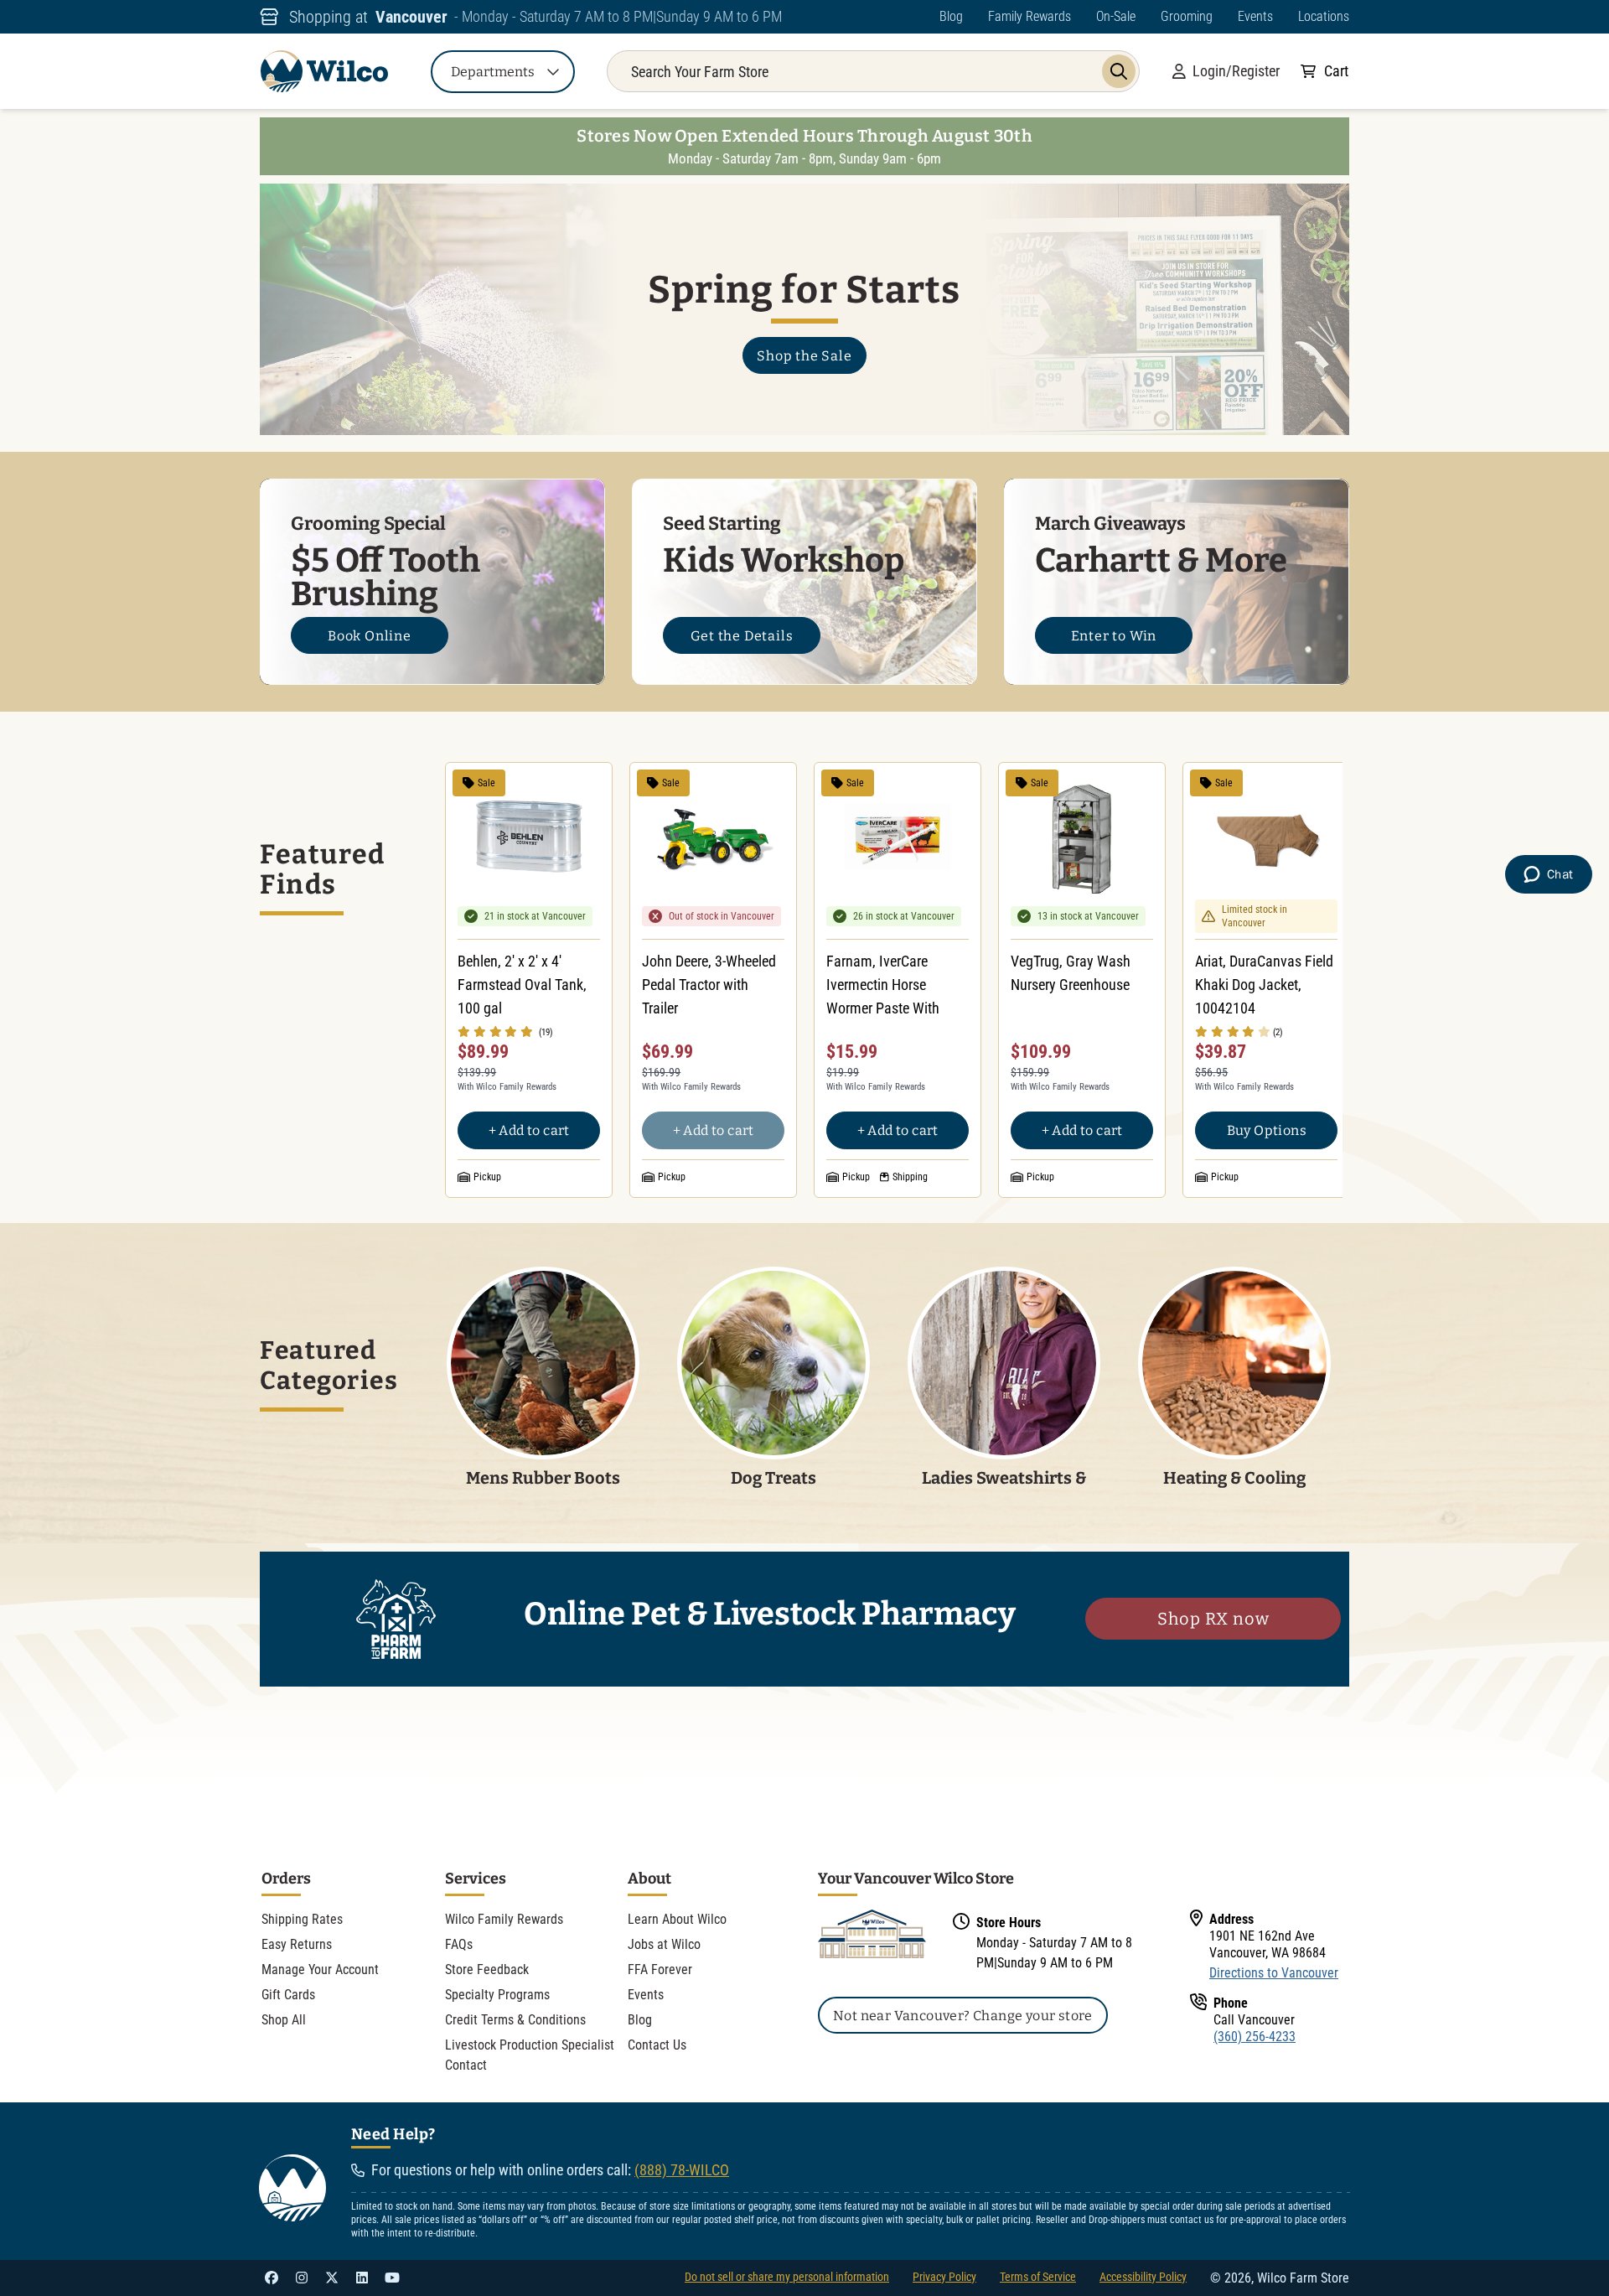
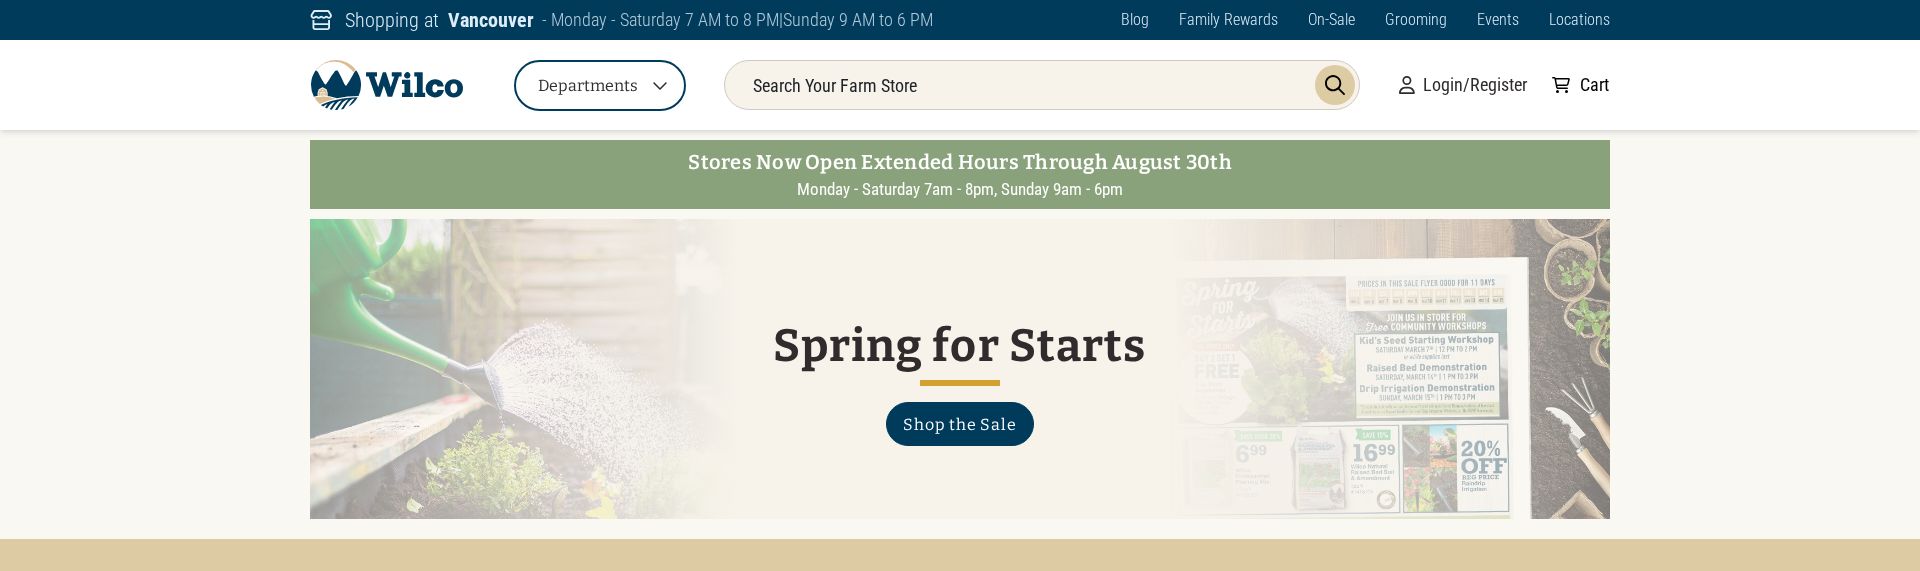
Where Wilco Farm Stores's Visitors Are Actually Looking
We used AI-powered attention prediction to understand how visitors perceive your page at first glance. Red areas indicate where visitors focus their attention most.
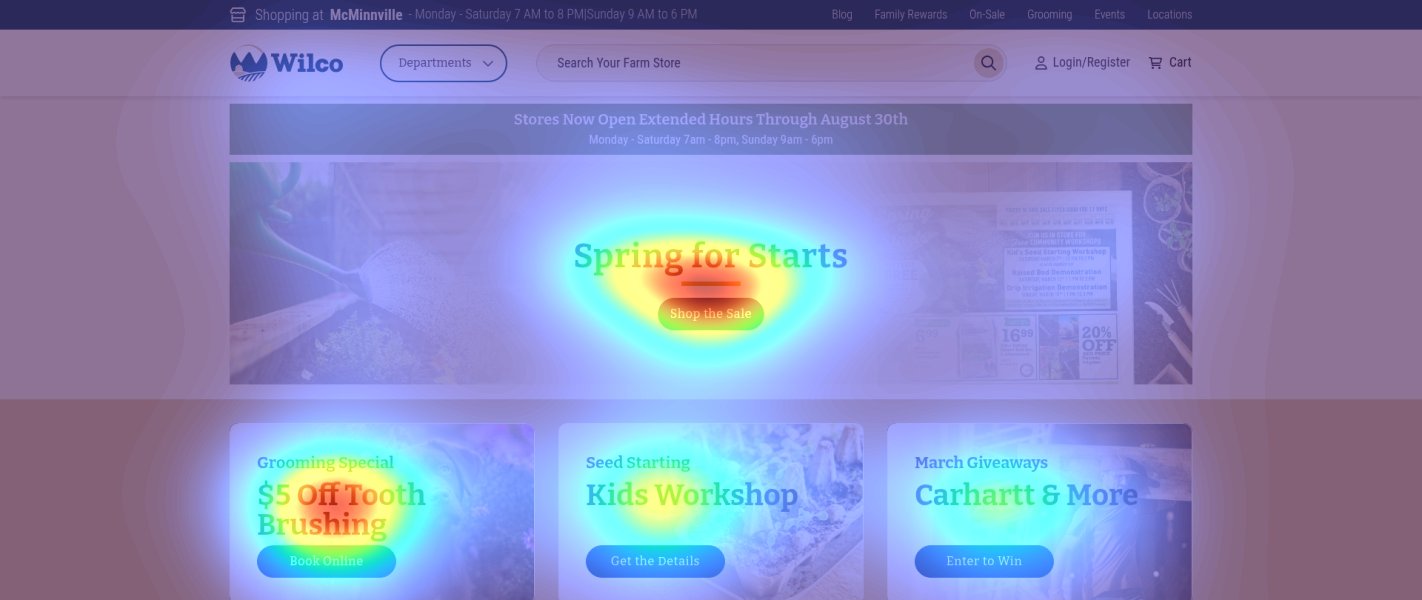
Top promotional banner with login/register buttons
The login/register buttons receive minimal attention despite being key conversion points, while users' focus is scattered across promotional text
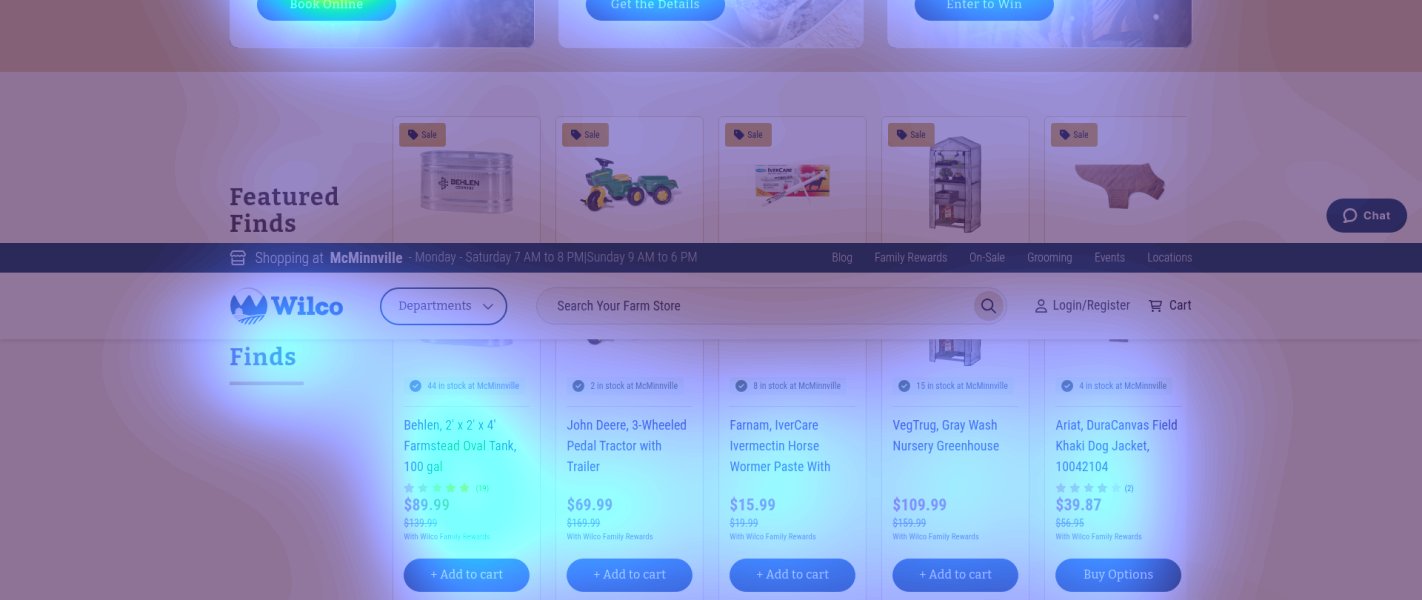
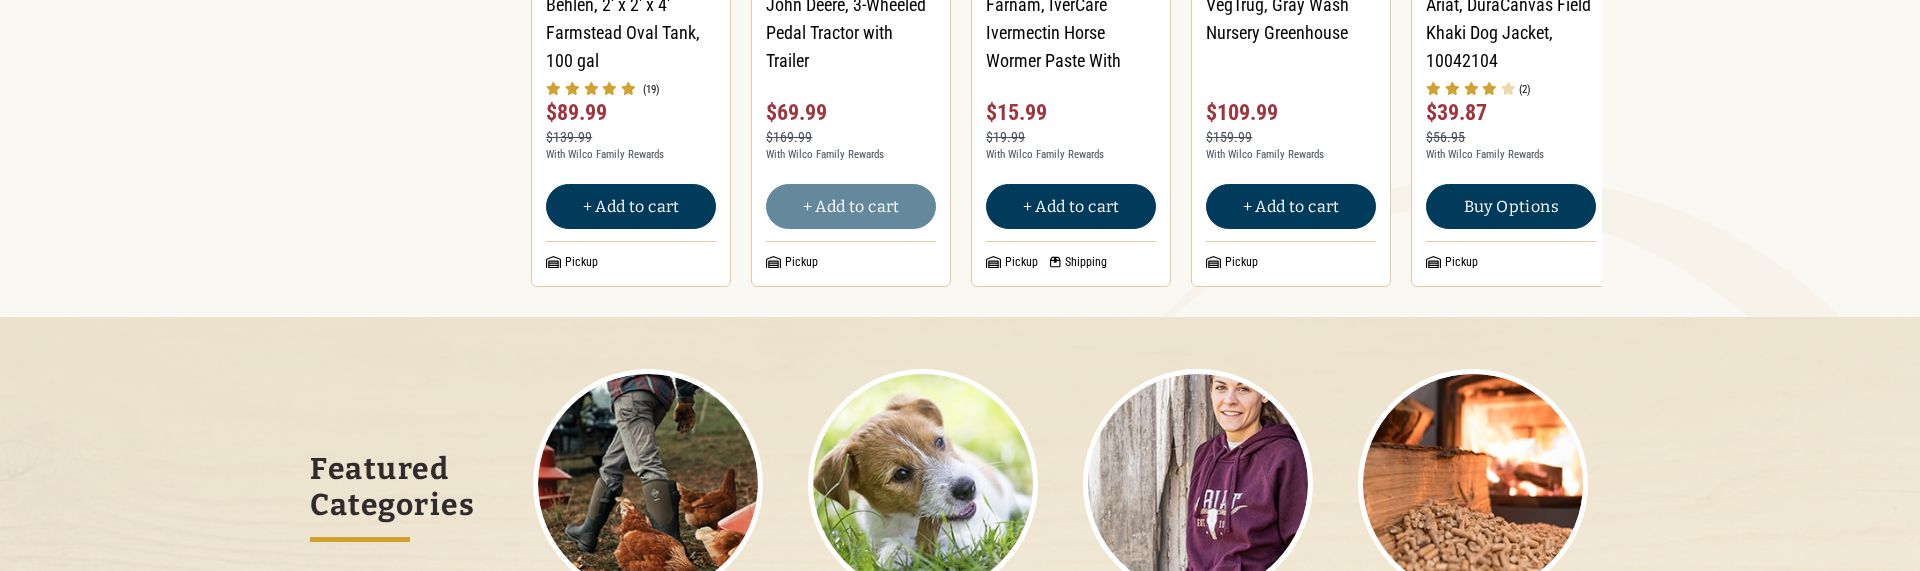
Product grid with pricing and add to cart buttons
Add to cart buttons receive minimal attention compared to product images and prices
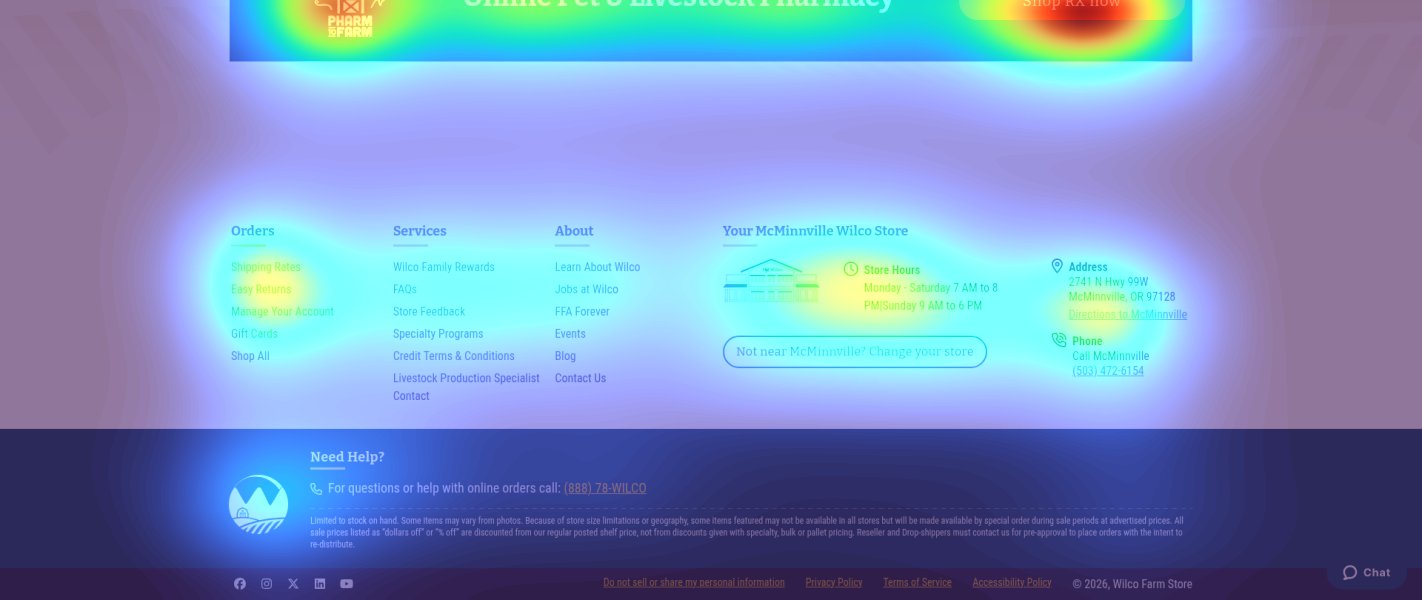
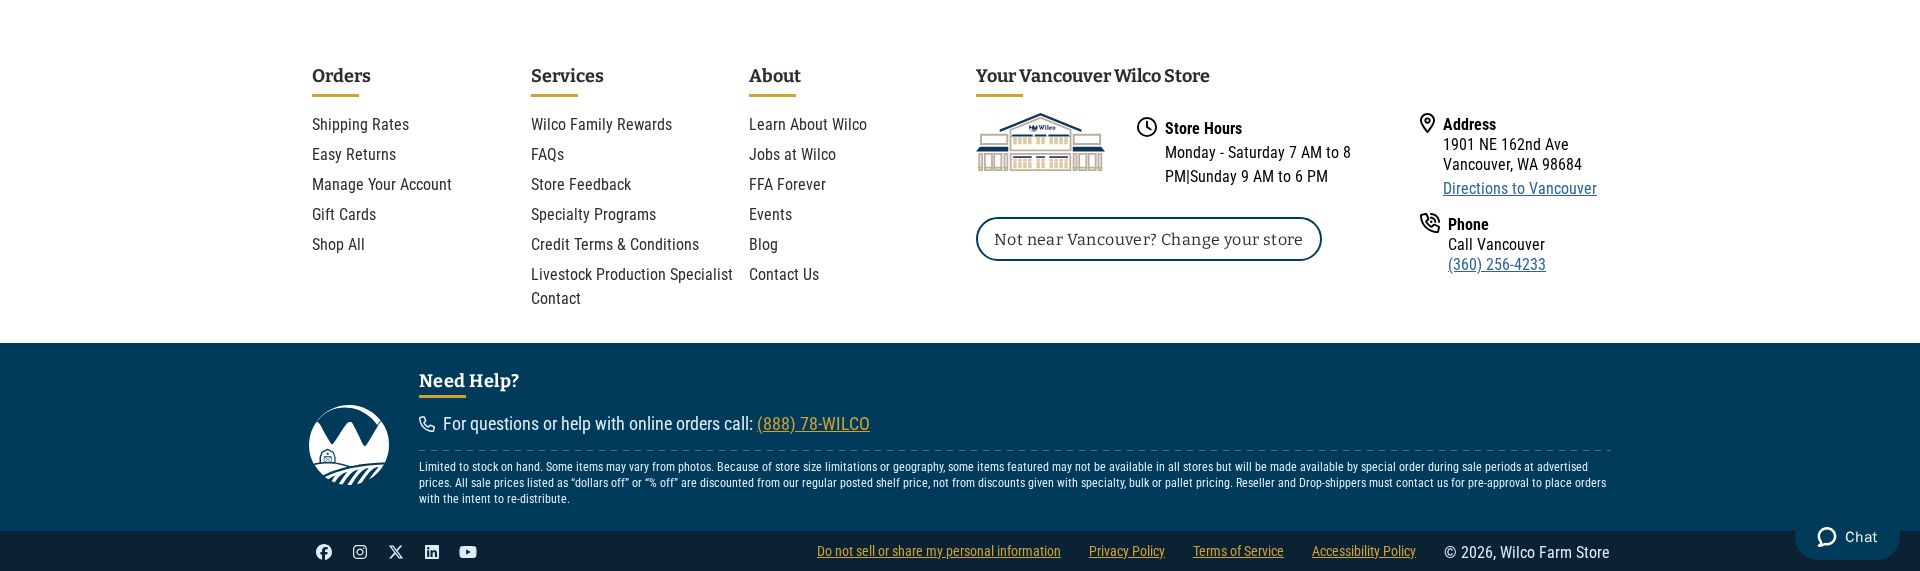
Store locator and hours section
The store locator section shows very low attention, indicating most users don't scroll this far
3 Critical Issues Affecting Wilco Farm Stores's Conversions
Issue: Enhance Login/Register Button Visibility
Login/register buttons in the header receive minimal attention (shown in heatmap) while users focus on promotional content, reducing account creation conversions
Issue: Optimize Add to Cart Button Design
Add to cart buttons in the product grid show low attention scores compared to product images and pricing, reducing conversion potential
Issue: Relocate Store Selector
Store locator shows very low attention in heatmap analysis due to being buried in footer, preventing users from finding local inventory
3 Specific Changes That Could Increase Revenue by $4.0M
Recommendation 1: Enhance Login/Register Button Visibility
Login/register buttons in the header receive minimal attention (shown in heatmap) while users focus on promotional content, reducing account creation conversions
Redesign the login/register buttons with increased visual hierarchy and reduced competing elements
Making account creation more prominent will increase member signups, leading to higher customer lifetime value and repeat purchases
Recommendation 2: Optimize Add to Cart Button Design
Add to cart buttons in the product grid show low attention scores compared to product images and pricing, reducing conversion potential
Redesign add to cart buttons to create stronger visual hierarchy and engagement
More prominent and engaging add to cart buttons will drive higher product page conversion rates
Recommendation 3: Relocate Store Selector
Store locator shows very low attention in heatmap analysis due to being buried in footer, preventing users from finding local inventory
Move store selection functionality to prominent position in main navigation
Easier store selection will increase local inventory visibility and drive more in-store visits
Combined Impact: Here's What Wilco Farm Stores Could Achieve
A conservative projection based on our methodology
Breakdown by Change
- Enhance Login/Register Button Visibility $127.5K/mo
- Optimize Add to Cart Button Design $127.5K/mo
- Relocate Store Selector $78.7K/mo
How Wilco Farm Stores Would Work With The Good
Our approach lets your team validate our methods before a larger digital experience investment.
Discovery & Baseline
Deep-dive into your analytics and user behavior
Goal Setting
Define success metrics and KPIs
Sprint Planning
Prioritize tests by impact and effort
A/B Testing
Execute, measure, and iterate
Ready to Capture That $4.0M in Revenue?
This is an initial AI-driven assessment to illustrate revenue potential. The next step is a comprehensive optimization program built for you. Every optimization program starts with a digital experience audit. During the audit our team of experts:
- Conducts in-depth user research and analytics review
- Performs heuristic evaluation of your complete funnel
- Identifies the biggest conversion barriers and opportunities in your digital experience
- Creates a prioritized roadmap based on impact and effort
Why Wilco Farm Stores Should Trust This Analysis
16+ Years Optimization Work
We've optimized hundreds of millions in revenue through our optimization programs.
Fortune 500 Clients
Worked with leading companies including Nike, Adobe, and Xerox.
Data-Driven Methodology
Our analysis is based on thousands of successful A/B tests across industries.