5-Minute Website Assessment Based on 16+ Years of Optimization Data
Revenue Opportunities Hidden in
Wip's User Experience
3 Free Data-Backed Website Optimization Opportunities
We analyzed Wip's digital experience using our proprietary database of 2,000+ tests, 10,000+ research data points, proprietary frameworks, and initial research methods. Now we've identified $57.6K in potential revenue improvements.
Our Methodology

To create this analysis, we:
- Analyzed your website's user experience patterns
- Compared against 200+ similar Consumer Packaged Goods (Beverages/Supplements) companies in our database
- Applied our DXO Heuristics framework
- Generated real-time heatmap data
- Cross-referenced with test results from past clients facing similar challenges
How we calculate revenue projections
Revenue projections are calculated using public estimates of your annual revenue, the conversion contribution of each page type, historical lift percentages from our database of thousands of experiments, and a confidence multiplier based on evidence strength. Total projected impact is capped at a percent of annual revenue to ensure conservative estimates.
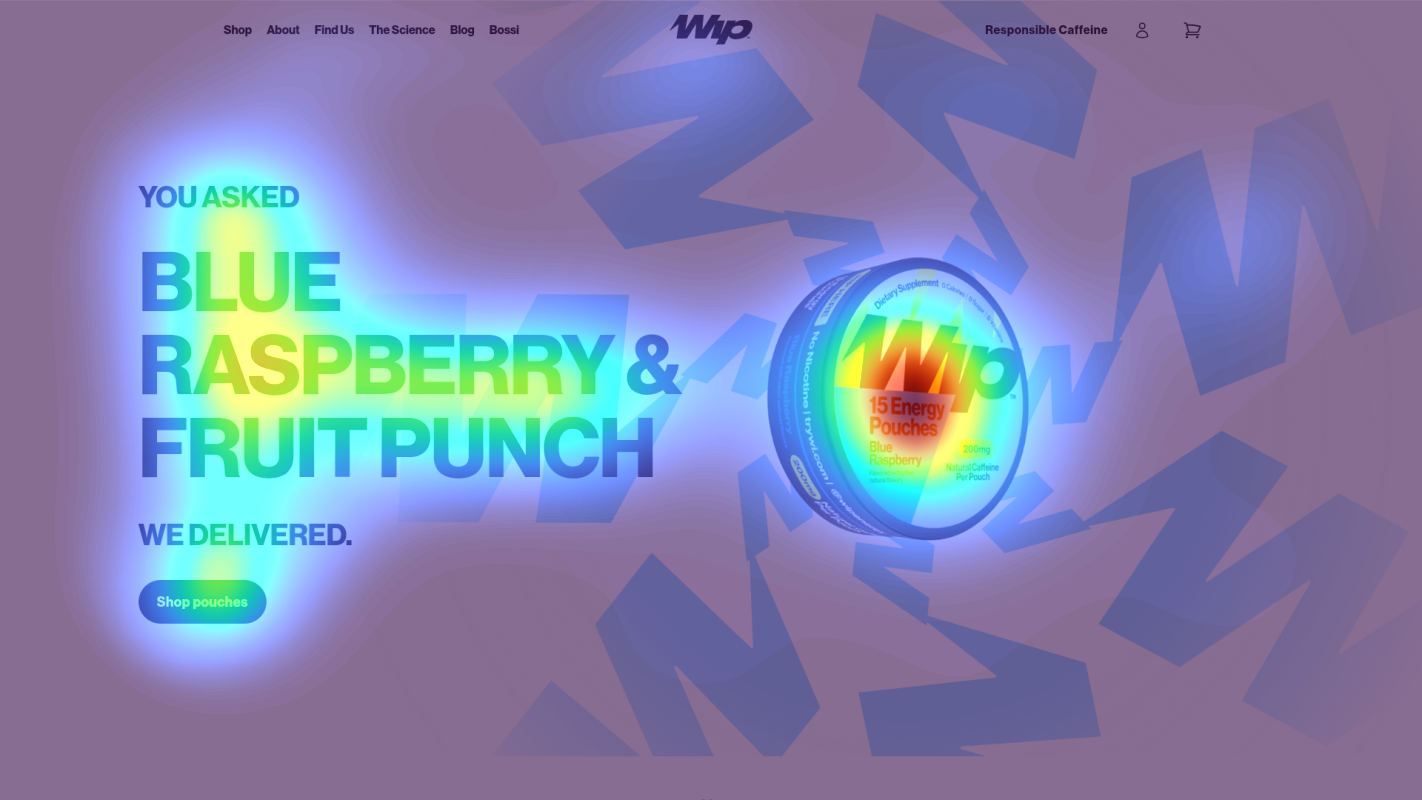
Where Wip's Visitors Are Actually Looking
We used AI-powered attention prediction to understand how visitors perceive your page at first glance. Red areas indicate where visitors focus their attention most.
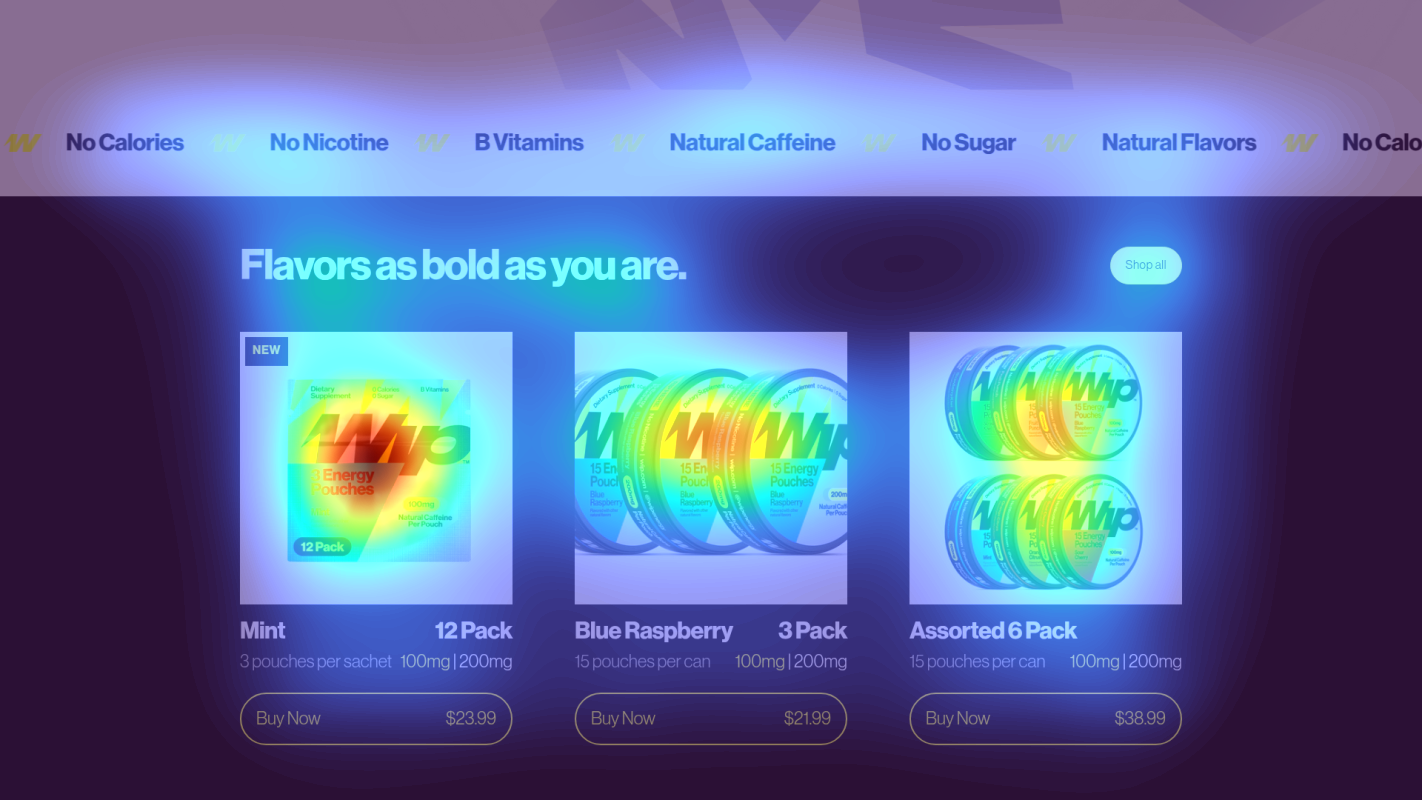
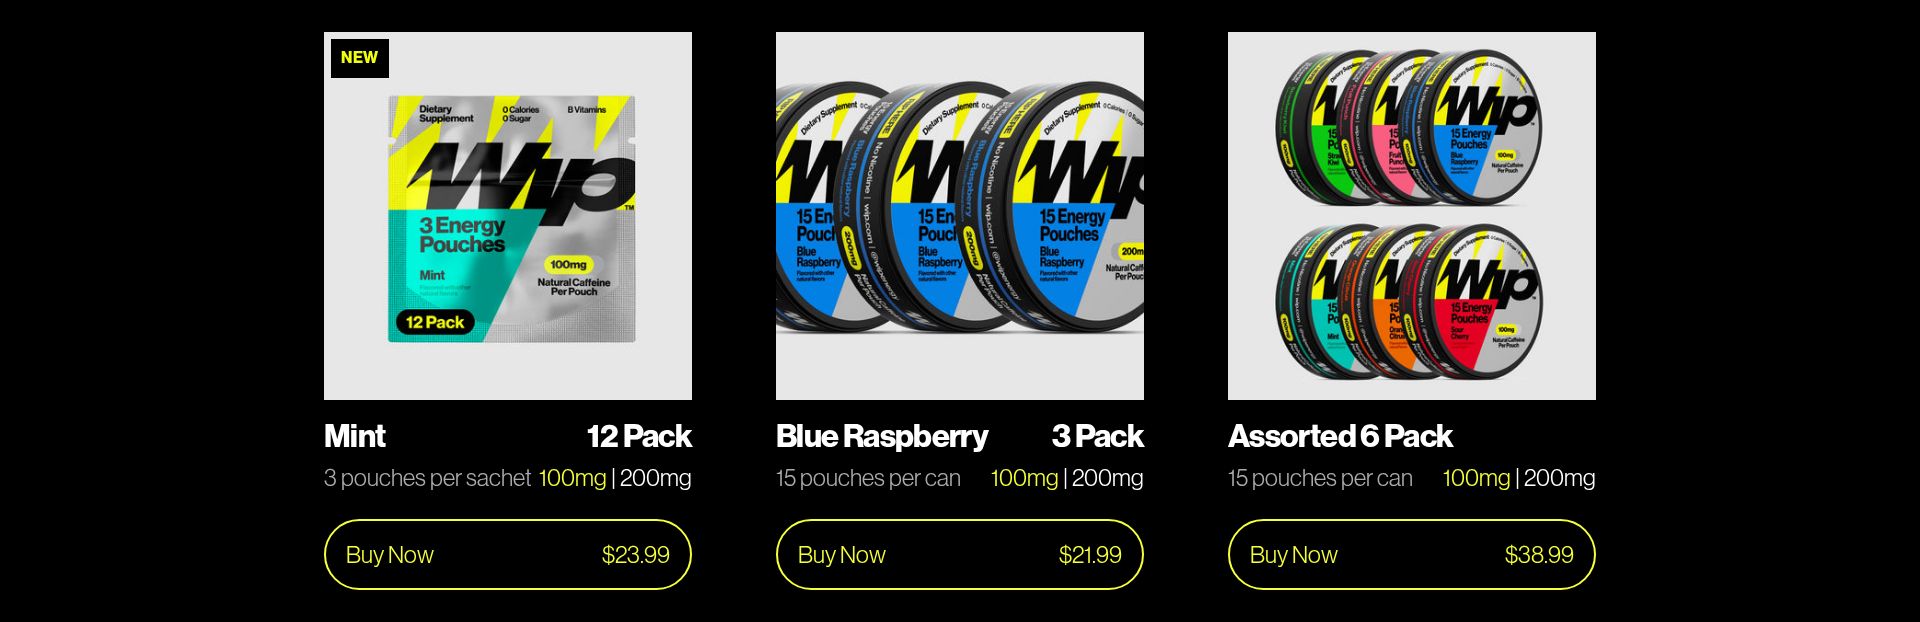
Product pricing and CTA section
The 'Buy Now' buttons and pricing are receiving low attention despite being critical conversion elements
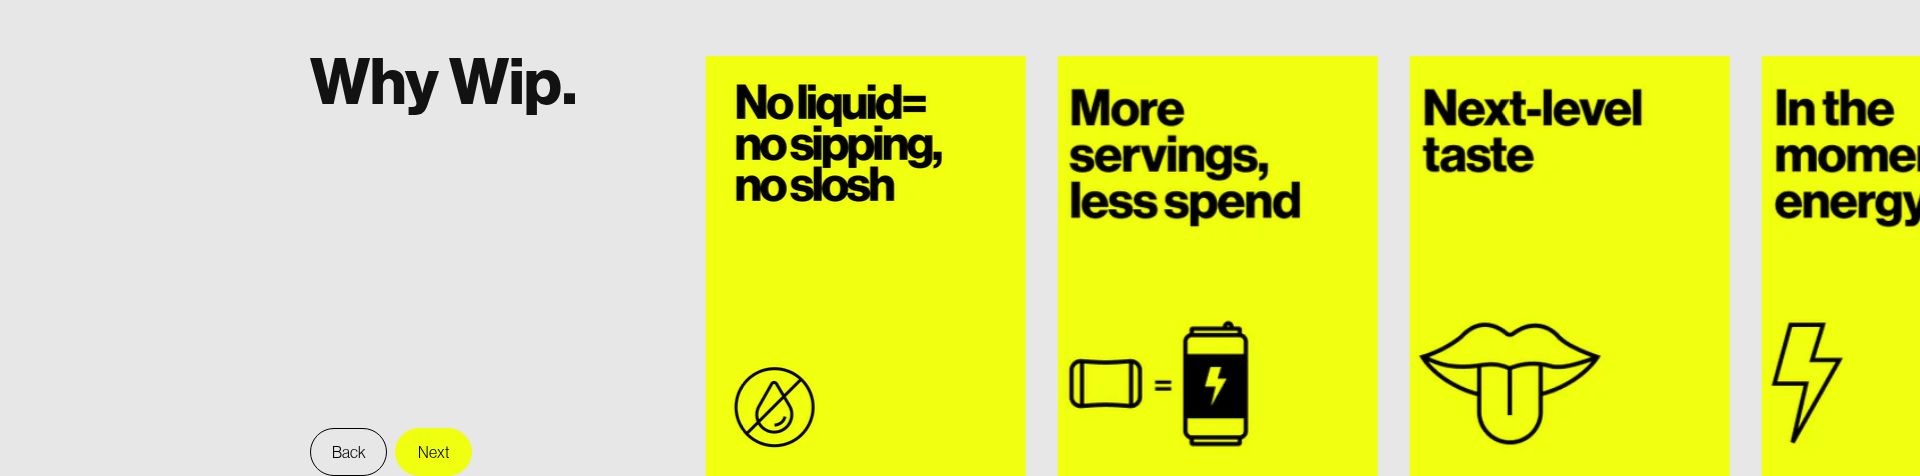
Why Wip section
The value proposition section is receiving minimal attention despite its importance in building product understanding
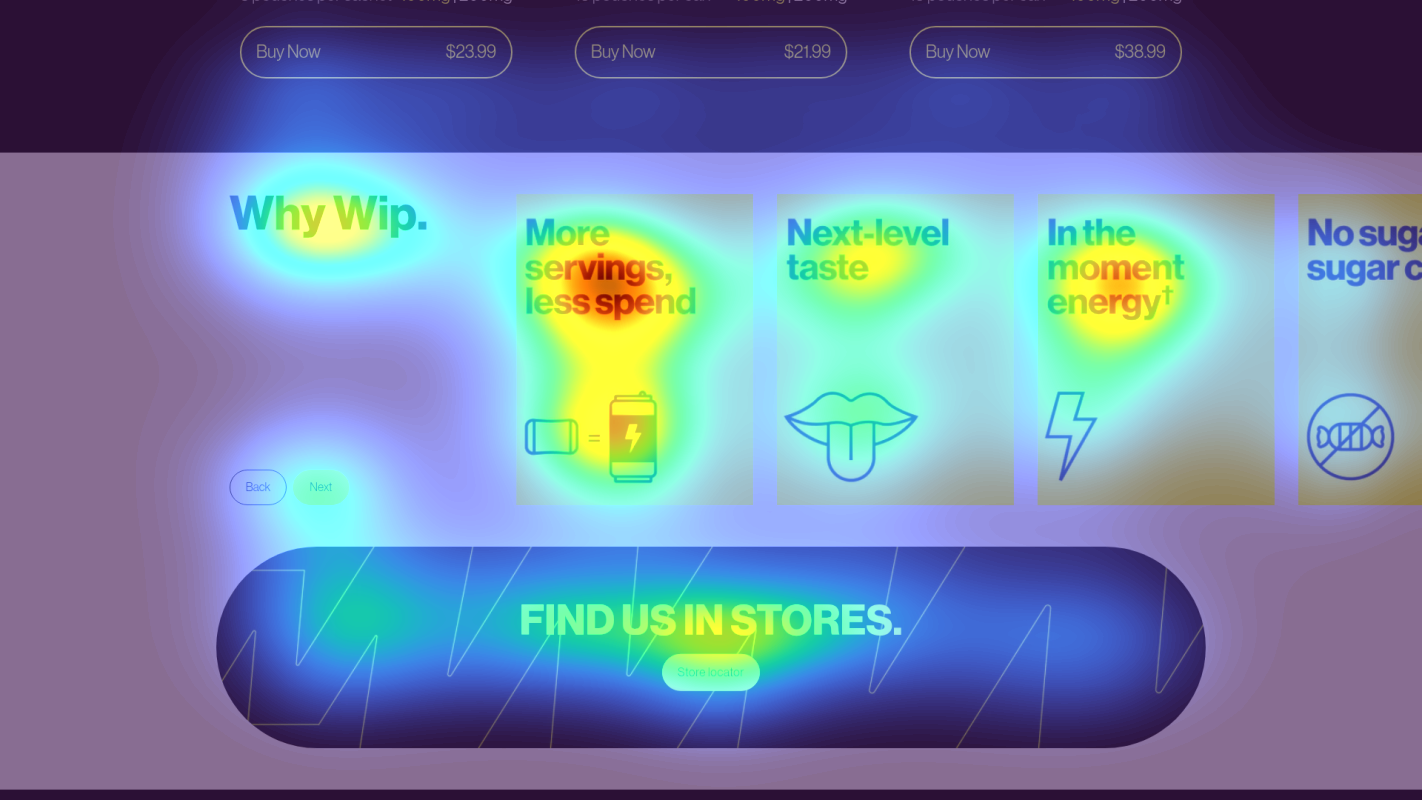
Email signup section
The email signup incentive is receiving low attention despite offering a valuable discount
3 Critical Issues Affecting Wip's Conversions
Issue: Optimize Product CTAs with Clear Hierarchy
Multiple 'Buy Now' buttons with equal visual weight are creating choice paralysis, evidenced by low attention scores in the heatmap for this critical conversion area. The pricing ($23.99, $21.99, $38.99) and CTAs are not effectively guiding users to take action.
Issue: Enhanced Value Proposition Display
The 'Why Wip' section shows minimal engagement in the heatmap despite being crucial for communicating product benefits. The current simple text approach isn't capturing user attention.
Issue: Optimize Email Signup Incentive
The email signup offering 10% off is receiving low attention in the heatmap despite its valuable offer. The current presentation lacks urgency and clear value communication.
3 Specific Changes That Could Increase Revenue by $57.6K
Recommendation 1: Optimize Product CTAs with Clear Hierarchy
Multiple 'Buy Now' buttons with equal visual weight are creating choice paralysis, evidenced by low attention scores in the heatmap for this critical conversion area. The pricing ($23.99, $21.99, $38.99) and CTAs are not effectively guiding users to take action.
Implement a clear visual hierarchy for the product options, with emphasis on the recommended choice. Highlight the best-selling option with a prominent design treatment and social proof.
Creating a clear visual hierarchy will guide users toward a primary choice, reducing decision paralysis and increasing conversion probability. Similar tests have shown 8-12% lift in add-to-cart rates.
Recommendation 2: Enhanced Value Proposition Display
The 'Why Wip' section shows minimal engagement in the heatmap despite being crucial for communicating product benefits. The current simple text approach isn't capturing user attention.
Redesign the 'Why Wip' section with visual elements and compelling statistics to better communicate the value proposition.
Visual presentation of benefits with supporting data points can increase user engagement and understanding, typically resulting in 8-15% improvement in progression to purchase.
Recommendation 3: Optimize Email Signup Incentive
The email signup offering 10% off is receiving low attention in the heatmap despite its valuable offer. The current presentation lacks urgency and clear value communication.
Enhance the email signup section with stronger incentives, visual emphasis, and urgency triggers.
Adding specific savings amounts and urgency elements typically increases email signup rates by 15-25%, creating more opportunities for future sales.

Combined Impact: Here's What Wip Could Achieve
A conservative projection based on our methodology
Breakdown by Change
- Optimize Product CTAs with Clear Hierarchy $1.7K/mo
- Enhanced Value Proposition Display $1.4K/mo
- Optimize Email Signup Incentive $1.7K/mo
How Wip Would Work With The Good
Our approach lets your team validate our methods before a larger digital experience investment.
Discovery & Baseline
Deep-dive into your analytics and user behavior
Goal Setting
Define success metrics and KPIs
Sprint Planning
Prioritize tests by impact and effort
A/B Testing
Execute, measure, and iterate
Ready to Capture That $57.6K in Revenue?
This is an initial AI-driven assessment to illustrate revenue potential. The next step is a comprehensive optimization program built for you. Every optimization program starts with a digital experience audit. During the audit our team of experts:
- Conducts in-depth user research and analytics review
- Performs heuristic evaluation of your complete funnel
- Identifies the biggest conversion barriers and opportunities in your digital experience
- Creates a prioritized roadmap based on impact and effort
Why Wip Should Trust This Analysis
16+ Years Optimization Work
We've optimized hundreds of millions in revenue through our optimization programs.
Fortune 500 Clients
Worked with leading companies including Nike, Adobe, and Xerox.
Data-Driven Methodology
Our analysis is based on thousands of successful A/B tests across industries.