5-Minute Website Assessment Based on 16+ Years of Optimization Data
Revenue Opportunities Hidden in
Athleta's User Experience
3 Free Data-Backed Website Optimization Opportunities
We analyzed Athleta's digital experience using our proprietary database of 2,000+ tests, 10,000+ research data points, proprietary frameworks, and initial research methods. Now we've identified $34.6M in potential revenue improvements.
Our Methodology

To create this analysis, we:
- Analyzed your website's user experience patterns
- Compared against 200+ similar Retail - Athletic Apparel companies in our database
- Applied our DXO Heuristics framework
- Generated real-time heatmap data
- Cross-referenced with test results from past clients facing similar challenges
How we calculate revenue projections
Revenue projections are calculated using public estimates of your annual revenue, the conversion contribution of each page type, historical lift percentages from our database of thousands of experiments, and a confidence multiplier based on evidence strength. Total projected impact is capped at a percent of annual revenue to ensure conservative estimates.
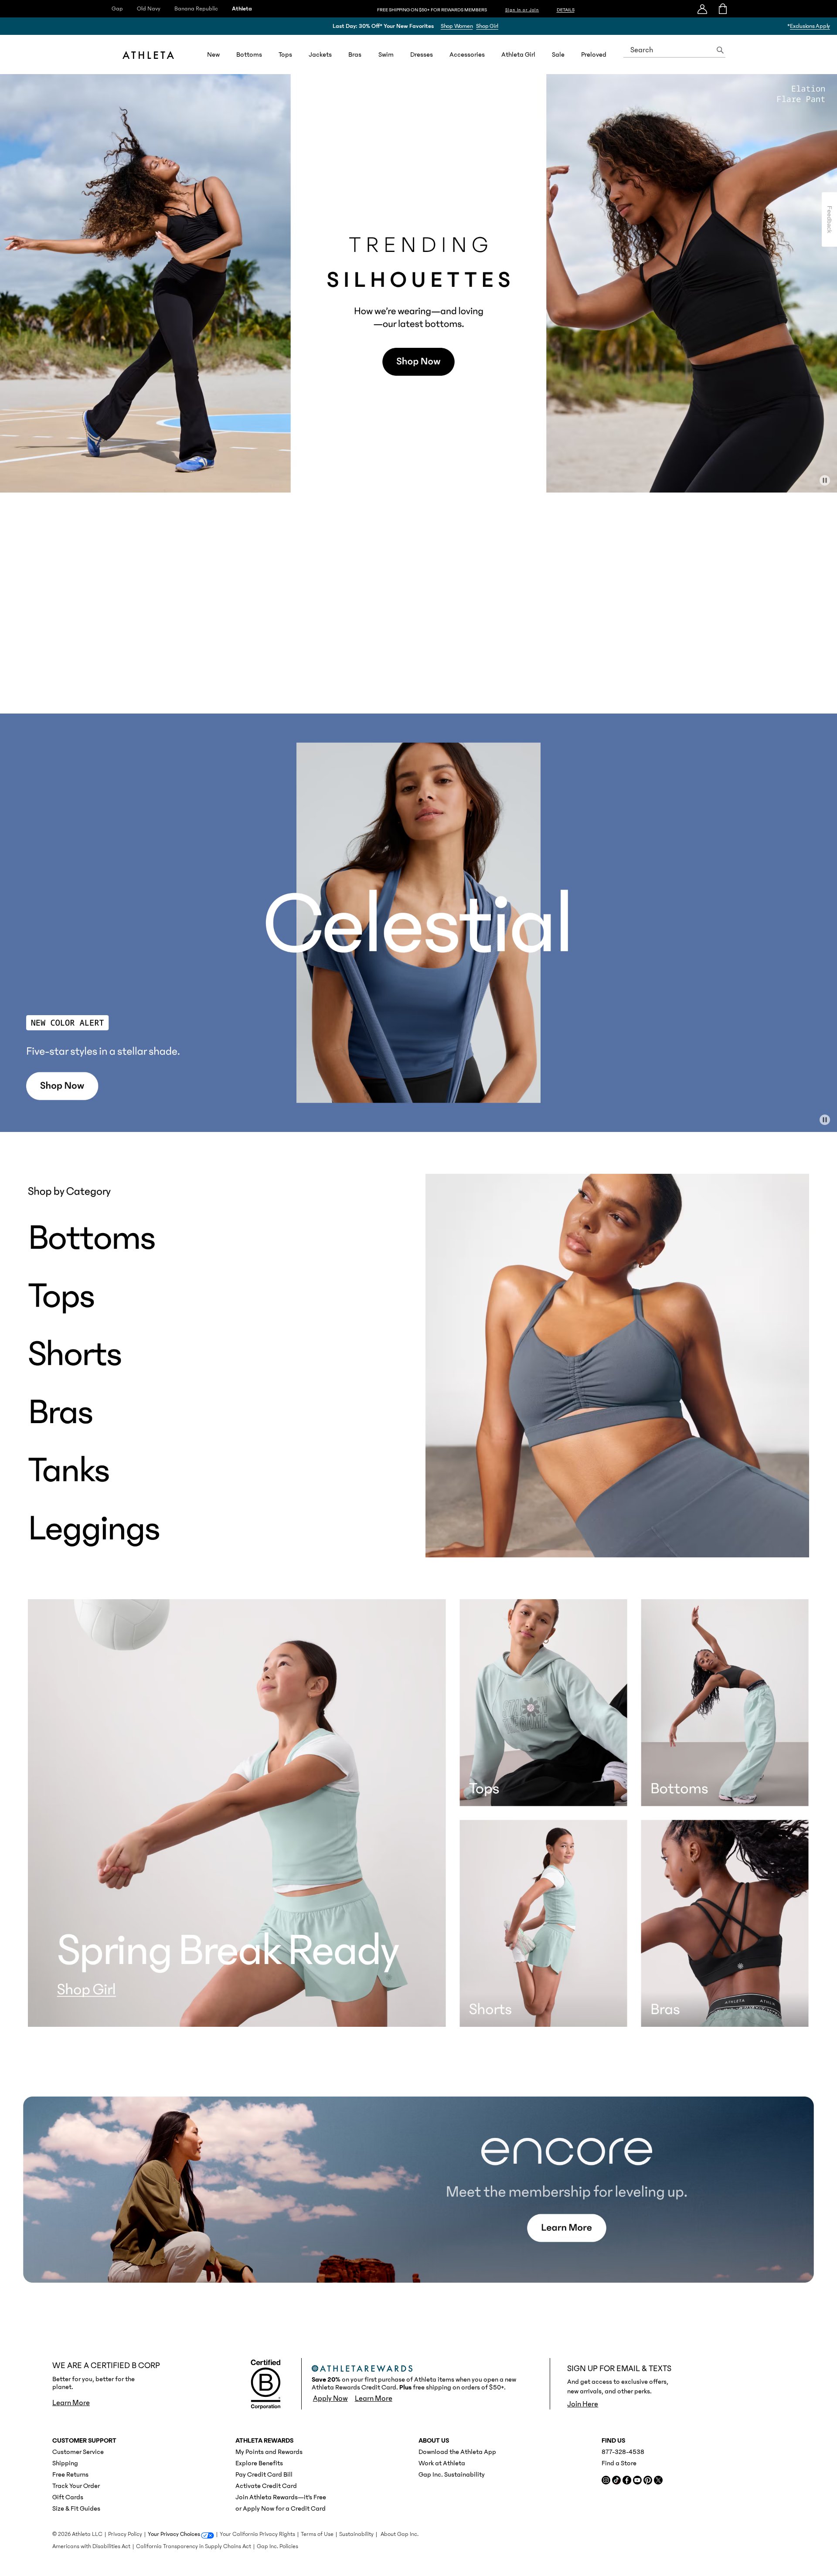
Where Athleta's Visitors Are Actually Looking
We used AI-powered attention prediction to understand how visitors perceive your page at first glance. Red areas indicate where visitors focus their attention most.
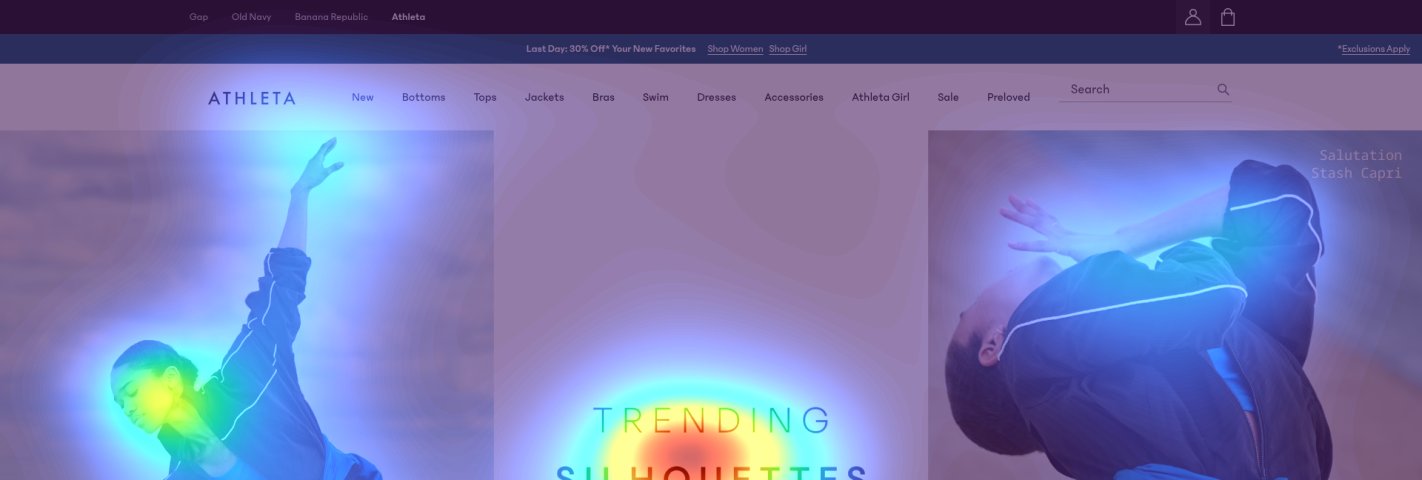
Free Shipping Banner
The free shipping promotion receives moderate attention but competes with multiple other header elements

Now Trending Section
The 'Now Trending' section receives scattered attention with no clear focal point

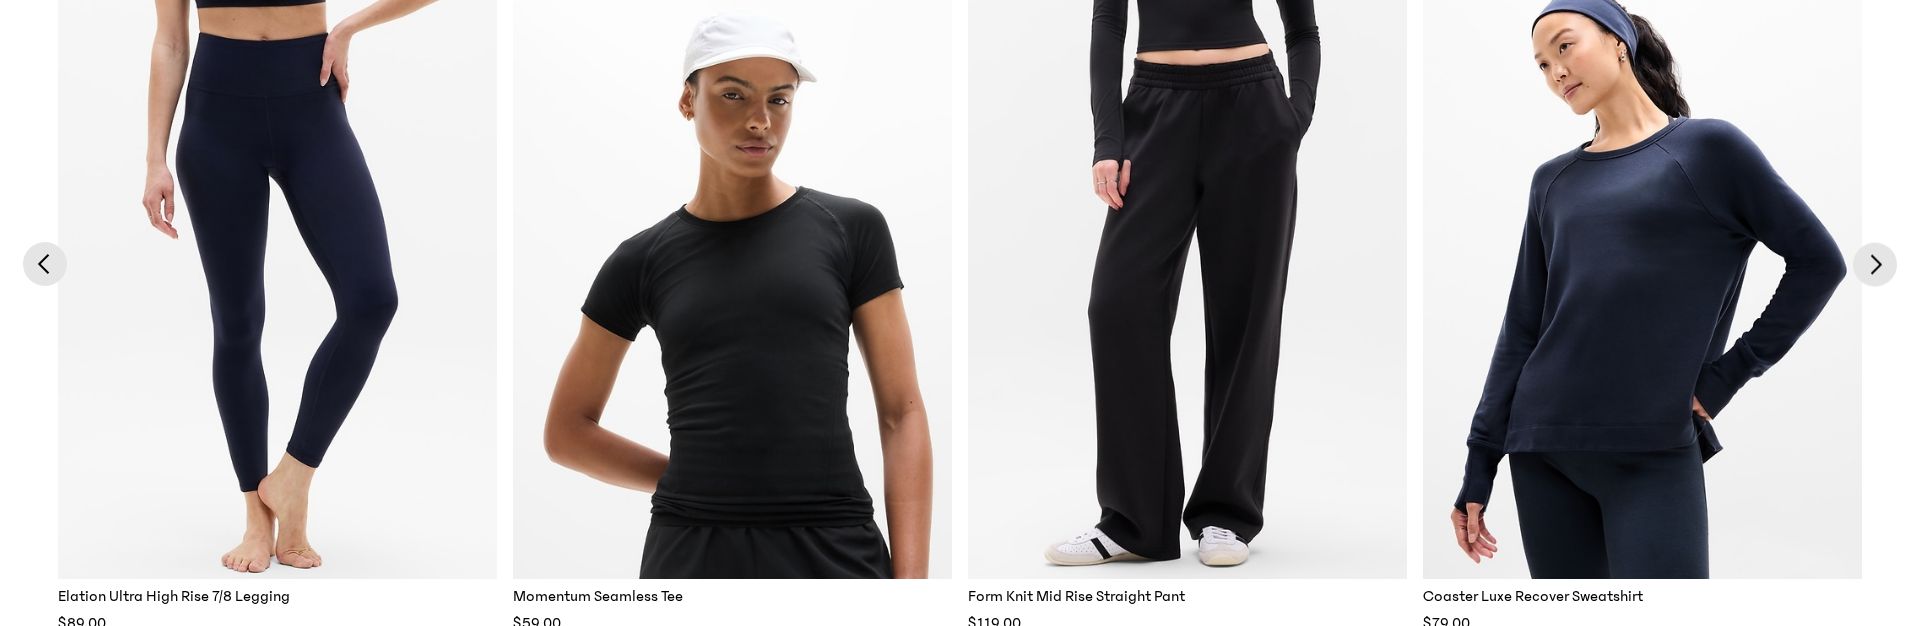
Product Category Section
Product titles and features receive minimal attention despite being key conversion elements
3 Critical Issues Affecting Athleta's Conversions
Issue: Consolidate and Emphasize Free Shipping Banner
The free shipping promotion ($50+ for rewards members) receives diluted attention due to competing header messages and small text size, reducing its effectiveness as an incentive
Issue: Enhance 'Now Trending' Section Visual Hierarchy
The Now Trending section shows scattered user attention with no clear focal points, preventing effective product discovery
Issue: Optimize Product Category Presentation
Product titles and features in the category section (sports bras and leggings) receive minimal attention despite being key conversion elements
3 Specific Changes That Could Increase Revenue by $34.6M
Recommendation 1: Consolidate and Emphasize Free Shipping Banner
The free shipping promotion ($50+ for rewards members) receives diluted attention due to competing header messages and small text size, reducing its effectiveness as an incentive
Redesign the header promotion area to feature a single, prominent banner that clearly communicates the free shipping offer and rewards program value proposition
Clear presentation of shipping incentives typically increases conversion rates by reducing a key friction point (shipping costs) early in the shopping journey

Recommendation 2: Enhance 'Now Trending' Section Visual Hierarchy
The Now Trending section shows scattered user attention with no clear focal points, preventing effective product discovery
Restructure the trending section with a clear visual hierarchy and featured items to guide user attention
Improved visual hierarchy in product discovery sections typically increases click-through rates to product pages

Recommendation 3: Optimize Product Category Presentation
Product titles and features in the category section (sports bras and leggings) receive minimal attention despite being key conversion elements
Enhance product presentations with benefit-focused headlines and social proof indicators
Clear communication of product benefits and social proof can increase product engagement and add-to-cart rates
Combined Impact: Here's What Athleta Could Achieve
A conservative projection based on our methodology
Breakdown by Change
- Consolidate and Emphasize Free Shipping Banner $1.0M/mo
- Enhance 'Now Trending' Section Visual Hierarchy $840.0K/mo
- Optimize Product Category Presentation $1.0M/mo
How Athleta Would Work With The Good
Our approach lets your team validate our methods before a larger digital experience investment.
Discovery & Baseline
Deep-dive into your analytics and user behavior
Goal Setting
Define success metrics and KPIs
Sprint Planning
Prioritize tests by impact and effort
A/B Testing
Execute, measure, and iterate
Ready to Capture That $34.6M in Revenue?
This is an initial AI-driven assessment to illustrate revenue potential. The next step is a comprehensive optimization program built for you. Every optimization program starts with a digital experience audit. During the audit our team of experts:
- Conducts in-depth user research and analytics review
- Performs heuristic evaluation of your complete funnel
- Identifies the biggest conversion barriers and opportunities in your digital experience
- Creates a prioritized roadmap based on impact and effort
Why Athleta Should Trust This Analysis
16+ Years Optimization Work
We've optimized hundreds of millions in revenue through our optimization programs.
Fortune 500 Clients
Worked with leading companies including Nike, Adobe, and Xerox.
Data-Driven Methodology
Our analysis is based on thousands of successful A/B tests across industries.