5-Minute Website Assessment Based on 16+ Years of Optimization Data
Revenue Opportunities Hidden in
Mejuri's User Experience
3 Free Data-Backed Website Optimization Opportunities
We analyzed Mejuri's digital experience using our proprietary database of 2,000+ tests, 10,000+ research data points, proprietary frameworks, and initial research methods. Now we've identified $4.3M in potential revenue improvements.
Our Methodology

To create this analysis, we:
- Analyzed your website's user experience patterns
- Compared against 200+ similar Retail - Fine Jewelry companies in our database
- Applied our DXO Heuristics framework
- Generated real-time heatmap data
- Cross-referenced with test results from past clients facing similar challenges
How we calculate revenue projections
Revenue projections are calculated using public estimates of your annual revenue, the conversion contribution of each page type, historical lift percentages from our database of thousands of experiments, and a confidence multiplier based on evidence strength. Total projected impact is capped at a percent of annual revenue to ensure conservative estimates.
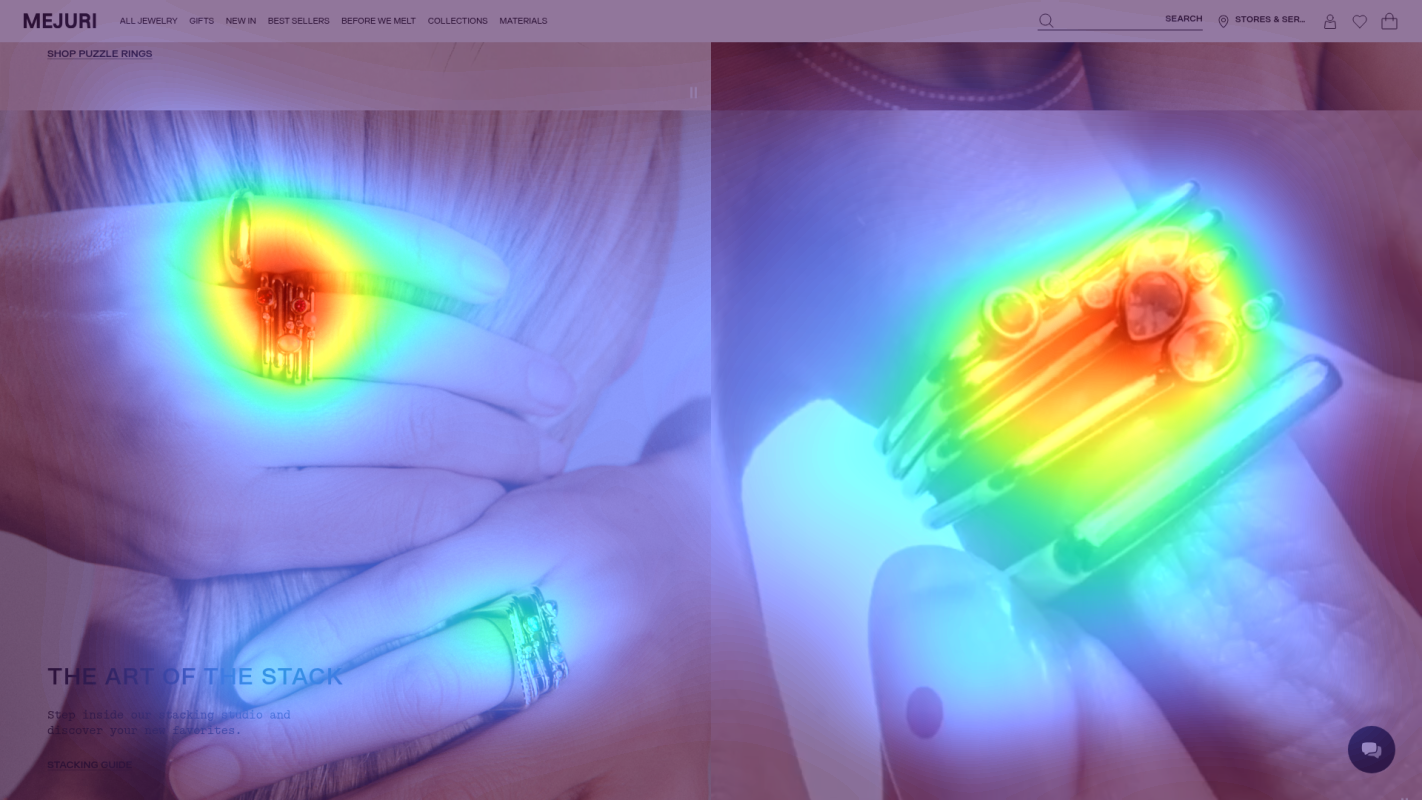
Where Mejuri's Visitors Are Actually Looking
We used AI-powered attention prediction to understand how visitors perceive your page at first glance. Red areas indicate where visitors focus their attention most.

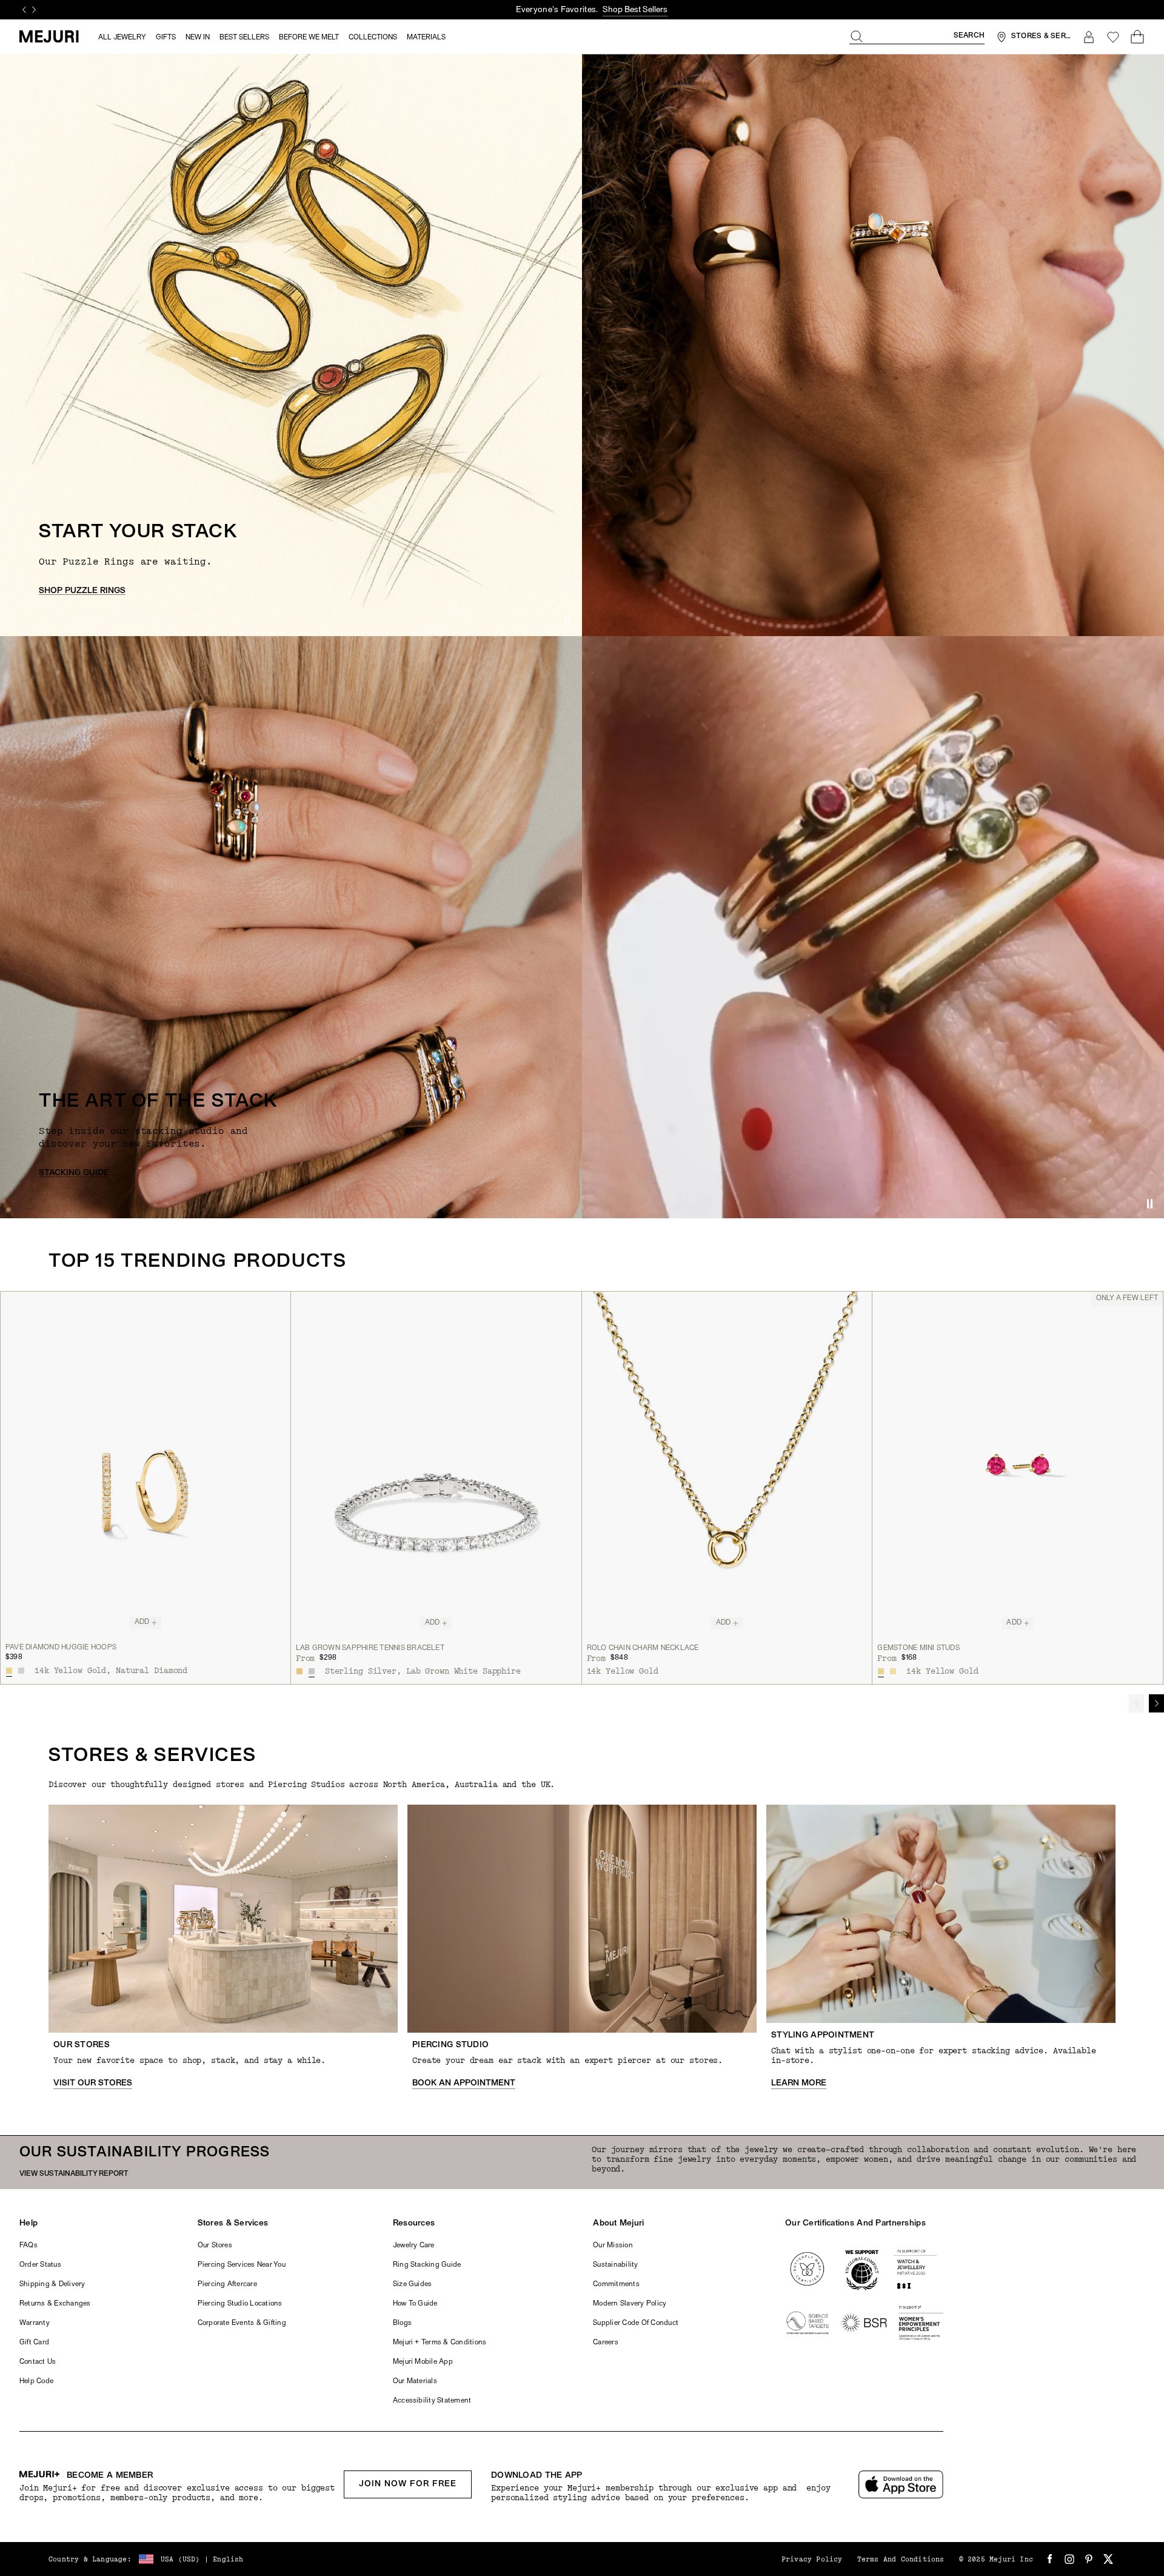
Main hero banner
The sustainability messaging receives moderate attention but fails to connect directly with purchase intent
Navigation menu
Navigation menu receives disproportionately high attention compared to product showcases
Trust signals section
Trust and certification elements receive minimal attention in cold zones
3 Critical Issues Affecting Mejuri's Conversions
Issue: Simplify 'Start Your Stack' Section with Clear Value Proposition
The 'START YOUR STACK' section uses insider jewelry terminology and lacks clear directional guidance, contributing to the heatmap's indication of fragmented user attention on the main hero banner.
Issue: Enhance Stacking Guide with Interactive Value Visualization
The 'THE ART OF THE STACK' section lacks engaging elements to maintain user attention, contributing to the heatmap's indication of scattered focus across multiple elements.
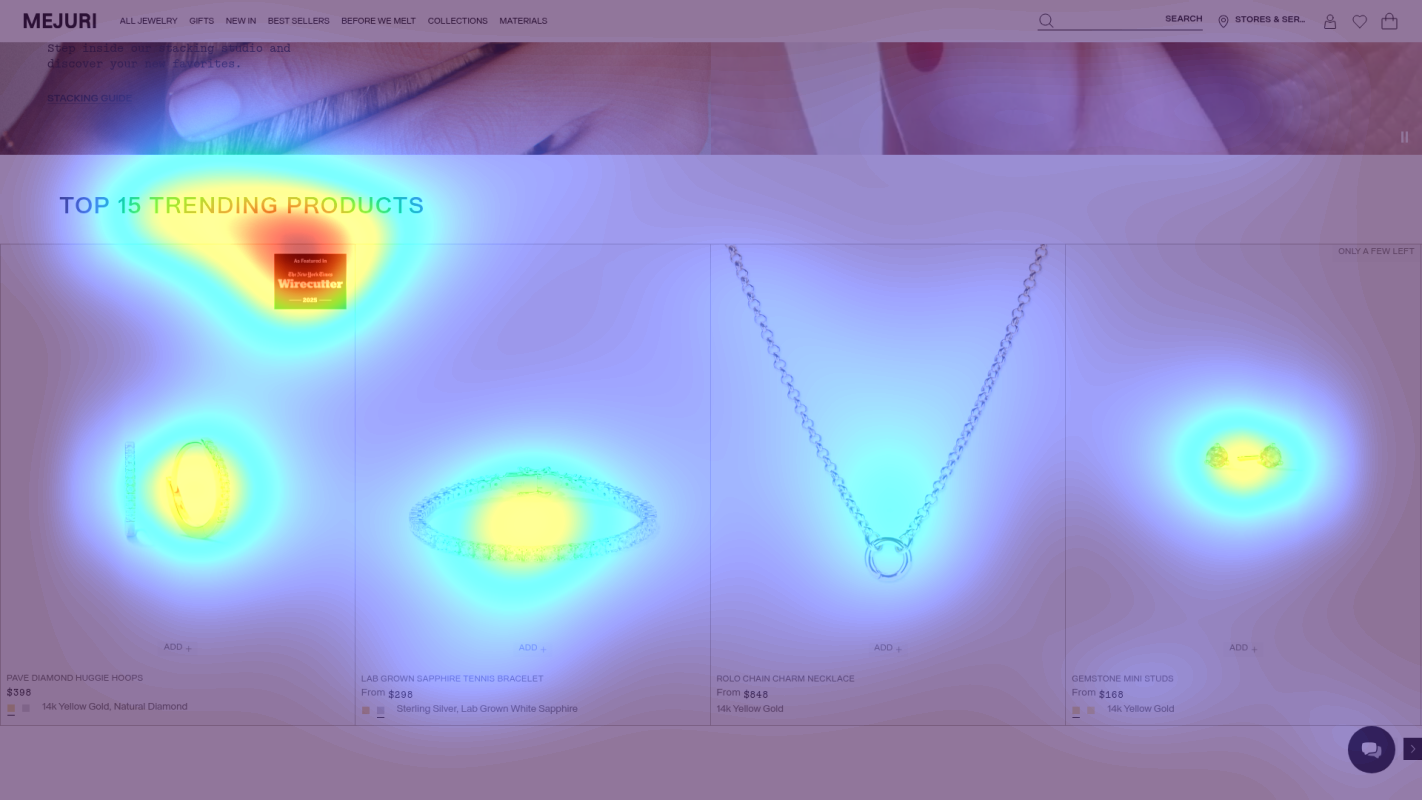
Issue: Optimize Trending Products with Trust-Enhanced Layout
The TOP 15 TRENDING PRODUCTS section shows multiple pricing formats and lacks trust signals, correlating with the heatmap's indication of minimal attention on trust elements.
3 Specific Changes That Could Increase Revenue by $4.3M
Recommendation 1: Simplify 'Start Your Stack' Section with Clear Value Proposition
The 'START YOUR STACK' section uses insider jewelry terminology and lacks clear directional guidance, contributing to the heatmap's indication of fragmented user attention on the main hero banner.
Revise the 'START YOUR STACK' section to lead with clear benefits and beginner-friendly language: 'Create Your Perfect Ring Collection' as the main heading, followed by 'Mix and match our bestselling rings for your unique style. Starting at $X' with visual previews of popular combinations.
Using more accessible language and showing clear value propositions will help new customers understand the concept immediately, reducing bounce rates and increasing engagement with product offerings.

Recommendation 2: Enhance Stacking Guide with Interactive Value Visualization
The 'THE ART OF THE STACK' section lacks engaging elements to maintain user attention, contributing to the heatmap's indication of scattered focus across multiple elements.
Transform the stacking guide section into an interactive showcase featuring real customer combinations with prices, ratings, and a 'Shop This Stack' button for each look. Add hover states showing individual pieces within each stack.
Visual demonstrations of actual stacks with clear pricing and social proof will help users envision their own combinations and provide clearer purchase paths.

Recommendation 3: Optimize Trending Products with Trust-Enhanced Layout
The TOP 15 TRENDING PRODUCTS section shows multiple pricing formats and lacks trust signals, correlating with the heatmap's indication of minimal attention on trust elements.
Redesign the trending products grid to include certification badges near prices, standardize price presentation, and add social proof elements (review stars, purchase count) for each item. Remove urgency messaging ('ONLY A FEW LEFT') and replace with authentic social proof.
Incorporating trust signals directly within the product grid will boost purchase confidence and create a more authentic shopping experience.

Combined Impact: Here's What Mejuri Could Achieve
A conservative projection based on our methodology
Breakdown by Change
- Simplify 'Start Your Stack' Section with Clear Value Proposition $127.5K/mo
- Enhance Stacking Guide with Interactive Value Visualization $105.0K/mo
- Optimize Trending Products with Trust-Enhanced Layout $127.5K/mo
How Mejuri Would Work With The Good
Our approach lets your team validate our methods before a larger digital experience investment.
Discovery & Baseline
Deep-dive into your analytics and user behavior
Goal Setting
Define success metrics and KPIs
Sprint Planning
Prioritize tests by impact and effort
A/B Testing
Execute, measure, and iterate
Ready to Capture That $4.3M in Revenue?
This is an initial AI-driven assessment to illustrate revenue potential. The next step is a comprehensive optimization program built for you. Every optimization program starts with a digital experience audit. During the audit our team of experts:
- Conducts in-depth user research and analytics review
- Performs heuristic evaluation of your complete funnel
- Identifies the biggest conversion barriers and opportunities in your digital experience
- Creates a prioritized roadmap based on impact and effort
Why Mejuri Should Trust This Analysis
16+ Years Optimization Work
We've optimized hundreds of millions in revenue through our optimization programs.
Fortune 500 Clients
Worked with leading companies including Nike, Adobe, and Xerox.
Data-Driven Methodology
Our analysis is based on thousands of successful A/B tests across industries.