5-Minute Website Assessment Based on 16+ Years of Optimization Data
Revenue Opportunities Hidden in
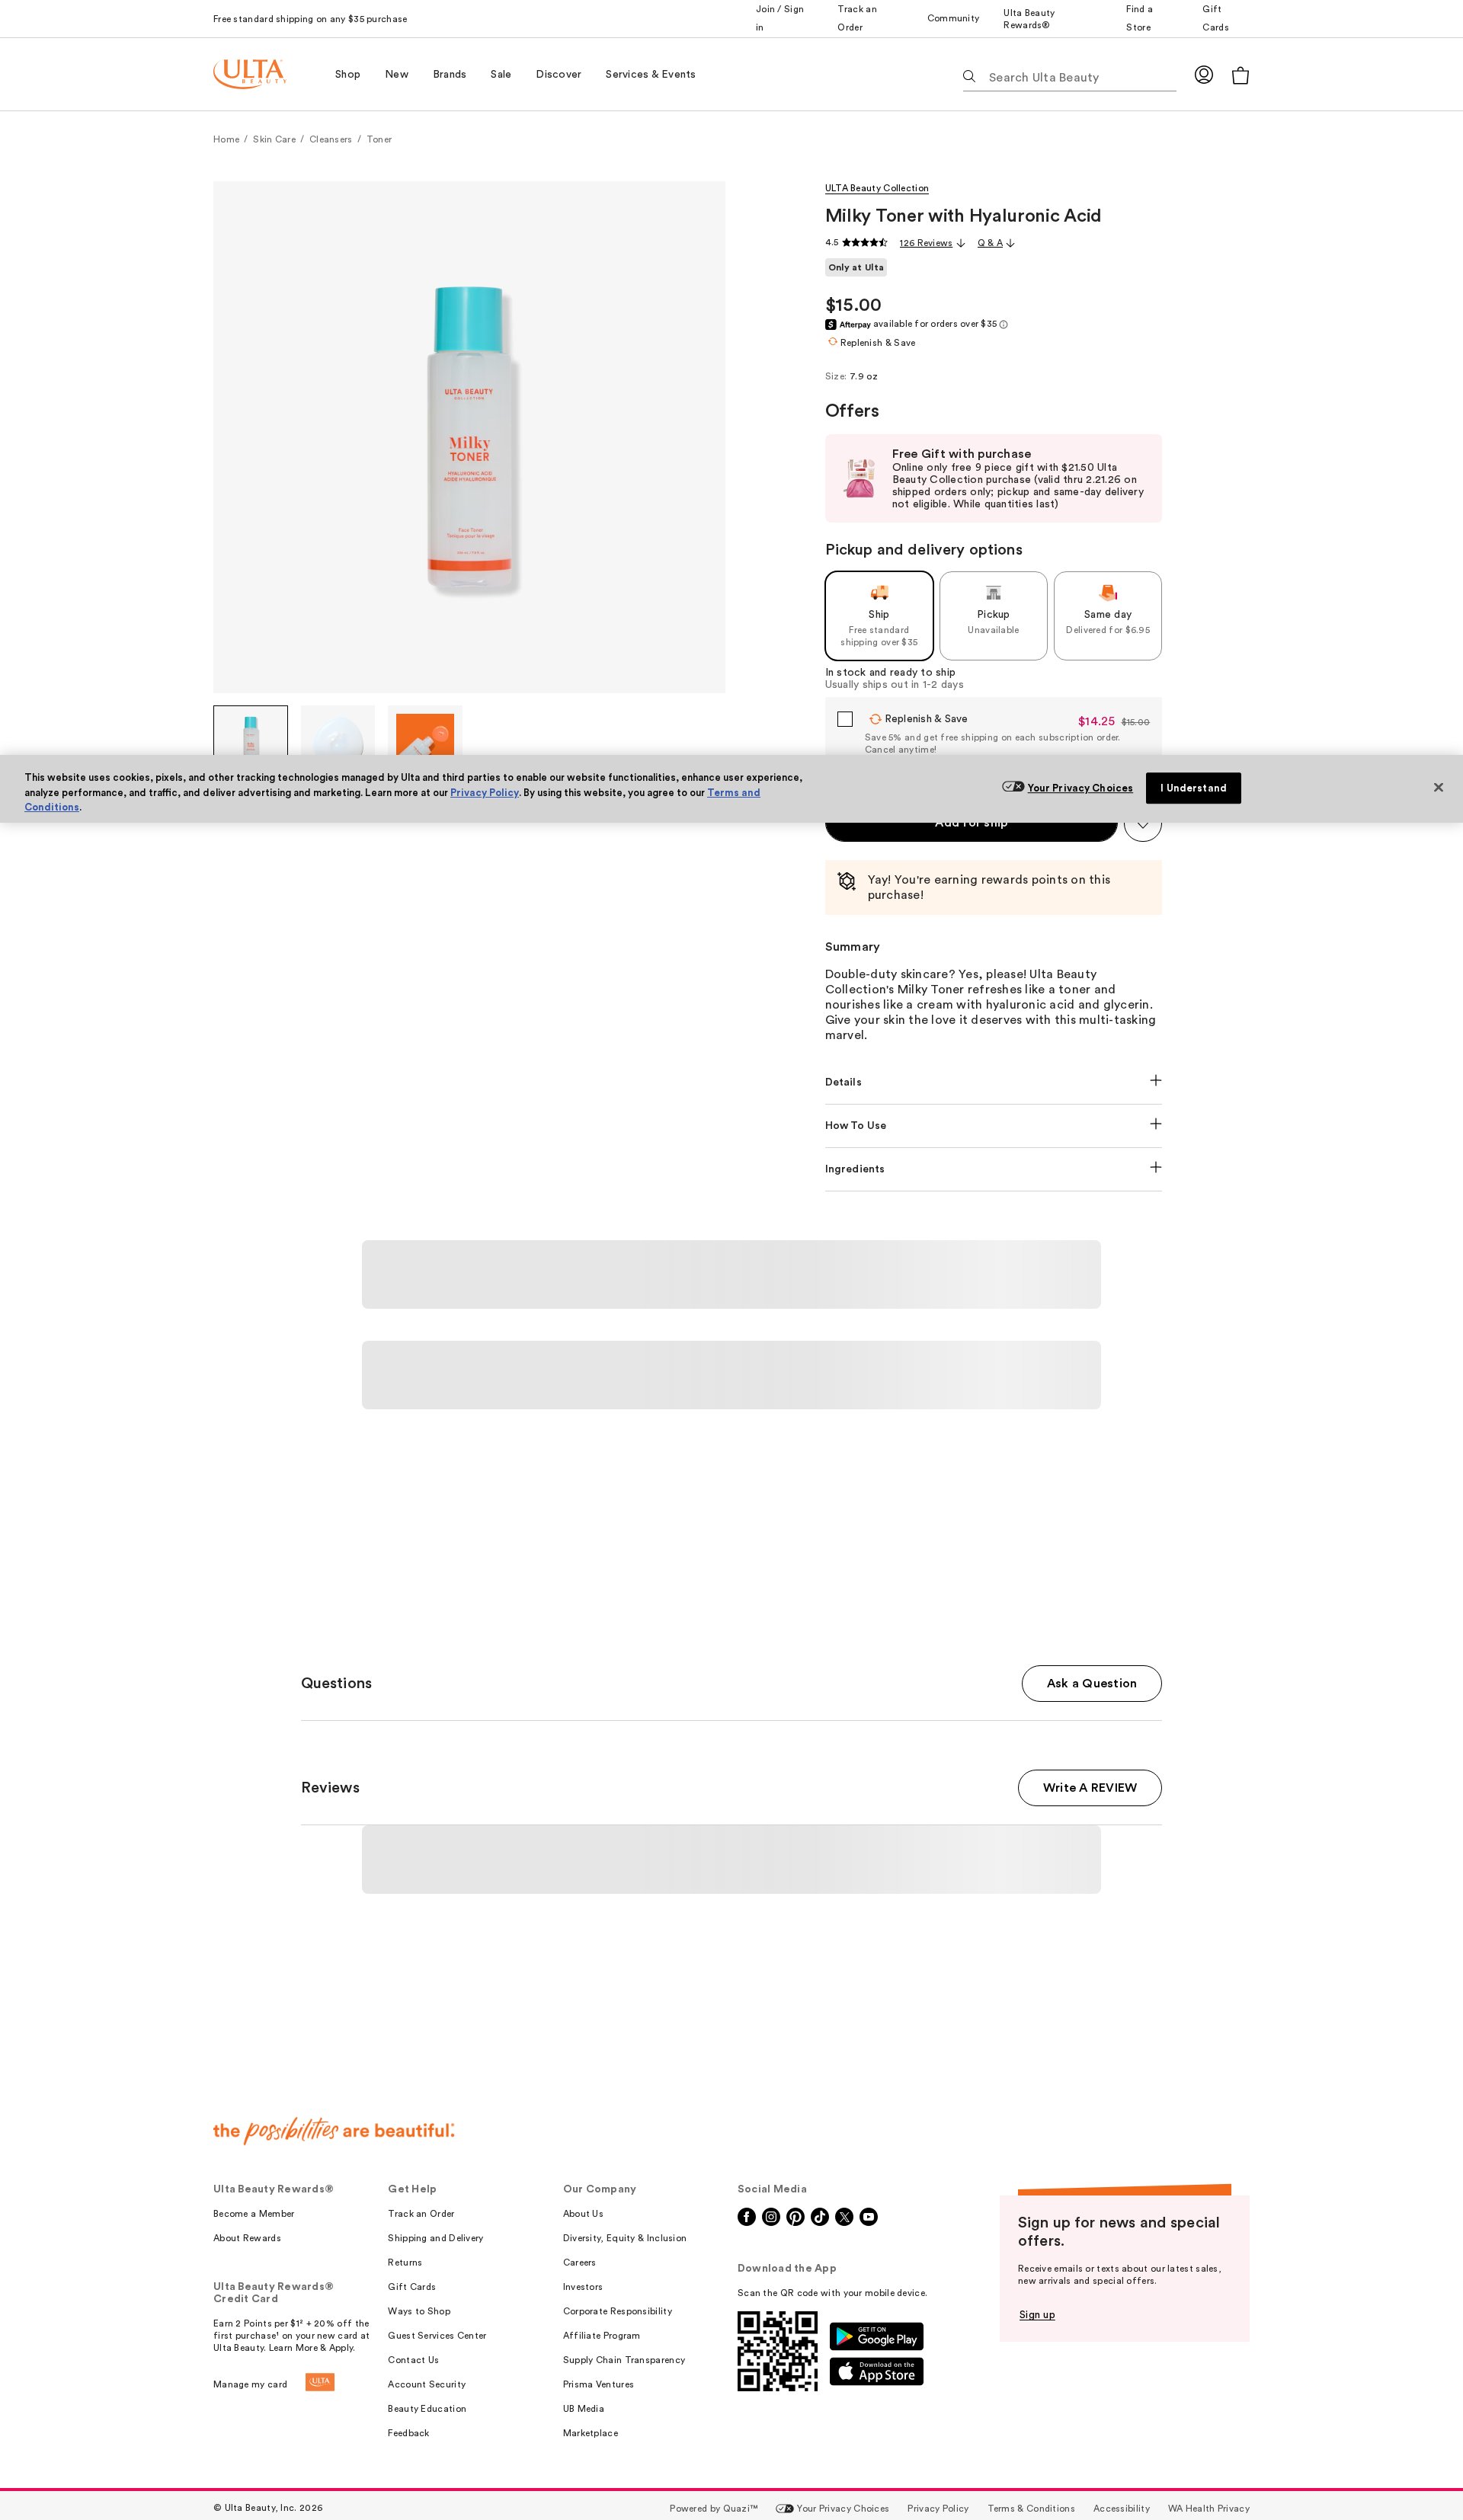
Ulta Beauty's User Experience
3 Free Data-Backed Website Optimization Opportunities
We analyzed Ulta Beauty's digital experience using our proprietary database of 2,000+ tests, 10,000+ research data points, proprietary frameworks, and initial research methods. Now we've identified $686.9M in potential revenue improvements.
Our Methodology

To create this analysis, we:
- Analyzed your website's user experience patterns
- Compared against 200+ similar Retail - Beauty & Cosmetics companies in our database
- Applied our DXO Heuristics framework
- Generated real-time heatmap data
- Cross-referenced with test results from past clients facing similar challenges
How we calculate revenue projections
Revenue projections are calculated using public estimates of your annual revenue, the conversion contribution of each page type, historical lift percentages from our database of thousands of experiments, and a confidence multiplier based on evidence strength. Total projected impact is capped at a percent of annual revenue to ensure conservative estimates.
3 Critical Issues Affecting Ulta Beauty's Conversions
Issue: Streamline Product Value Proposition
The product title section (0-400px) contains competing elements that dilute the main value proposition, including scattered placement of product title, ratings, price, and subscription options
Issue: Simplify Purchase Options Flow
Multiple purchasing options (300-600px) creating decision paralysis with competing one-time purchase, subscription, and delivery choices
Issue: Minimize Header Navigation Complexity
Complex navigation header (0-150px) with multiple sections and promotional messages distracting from purchase journey
3 Specific Changes That Could Increase Revenue by $686.9M
Recommendation 1: Streamline Product Value Proposition
The product title section (0-400px) contains competing elements that dilute the main value proposition, including scattered placement of product title, ratings, price, and subscription options
Create a clear visual hierarchy by restructuring the product title area into distinct sections: (1) Product name & rating, (2) Price with subscription option as secondary, (3) Clear primary CTA
Reducing cognitive load and creating clear visual hierarchy will help users quickly understand the product value and make a purchase decision

Recommendation 2: Simplify Purchase Options Flow
Multiple purchasing options (300-600px) creating decision paralysis with competing one-time purchase, subscription, and delivery choices
Create a stepped purchase flow: (1) Select size, (2) Choose one-time/subscription with clear savings callout, (3) Delivery method with estimated dates
Sequential decision-making reduces cognitive load and makes the purchase process feel more manageable

Recommendation 3: Minimize Header Navigation Complexity
Complex navigation header (0-150px) with multiple sections and promotional messages distracting from purchase journey
Implement a simplified sticky header that maintains only essential elements during product page scroll: Logo, Cart, Search, and primary navigation categories
Reducing navigation complexity keeps users focused on product consideration and purchase

Combined Impact: Here's What Ulta Beauty Could Achieve
A conservative projection based on our methodology
Breakdown by Change
- Streamline Product Value Proposition $24.5M/mo
- Simplify Purchase Options Flow $20.2M/mo
- Minimize Header Navigation Complexity $12.6M/mo
How Ulta Beauty Would Work With The Good
Our approach lets your team validate our methods before a larger digital experience investment.
Discovery & Baseline
Deep-dive into your analytics and user behavior
Goal Setting
Define success metrics and KPIs
Sprint Planning
Prioritize tests by impact and effort
A/B Testing
Execute, measure, and iterate
Ready to Capture That $686.9M in Revenue?
This is an initial AI-driven assessment to illustrate revenue potential. The next step is a comprehensive optimization program built for you. Every optimization program starts with a digital experience audit. During the audit our team of experts:
- Conducts in-depth user research and analytics review
- Performs heuristic evaluation of your complete funnel
- Identifies the biggest conversion barriers and opportunities in your digital experience
- Creates a prioritized roadmap based on impact and effort
Why Ulta Beauty Should Trust This Analysis
16+ Years Optimization Work
We've optimized hundreds of millions in revenue through our optimization programs.
Fortune 500 Clients
Worked with leading companies including Nike, Adobe, and Xerox.
Data-Driven Methodology
Our analysis is based on thousands of successful A/B tests across industries.