5-Minute Website Assessment Based on 16+ Years of Optimization Data
Revenue Opportunities Hidden in
Mejuri's User Experience
3 Free Data-Backed Website Optimization Opportunities
We analyzed Mejuri's digital experience using our proprietary database of 2,000+ tests, 10,000+ research data points, proprietary frameworks, and initial research methods. Now we've identified $4.3M in potential revenue improvements.
Our Methodology

To create this analysis, we:
- Analyzed your website's user experience patterns
- Compared against 200+ similar Retail - Fine Jewelry companies in our database
- Applied our DXO Heuristics framework
- Generated real-time heatmap data
- Cross-referenced with test results from past clients facing similar challenges
How we calculate revenue projections
Revenue projections are calculated using public estimates of your annual revenue, the conversion contribution of each page type, historical lift percentages from our database of thousands of experiments, and a confidence multiplier based on evidence strength. Total projected impact is capped at a percent of annual revenue to ensure conservative estimates.
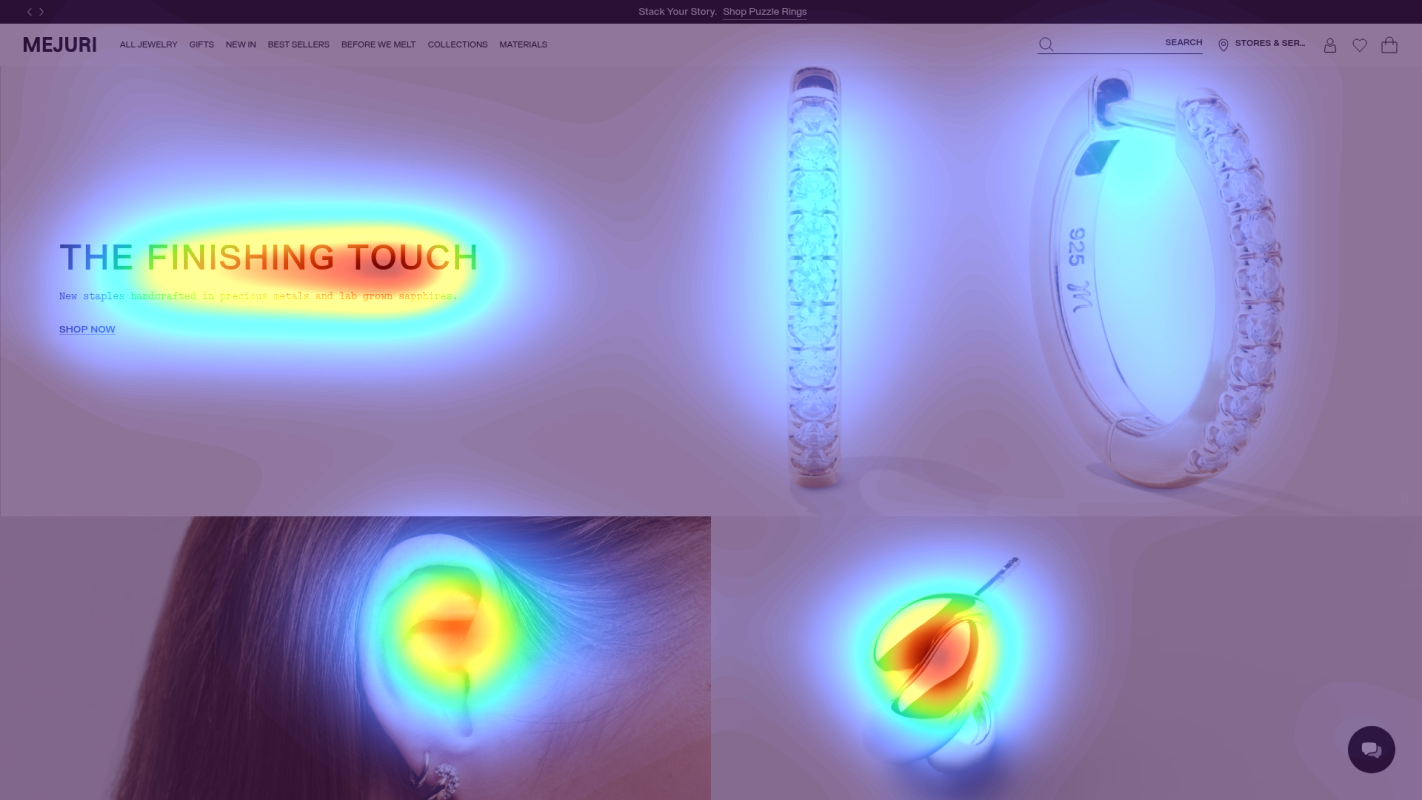
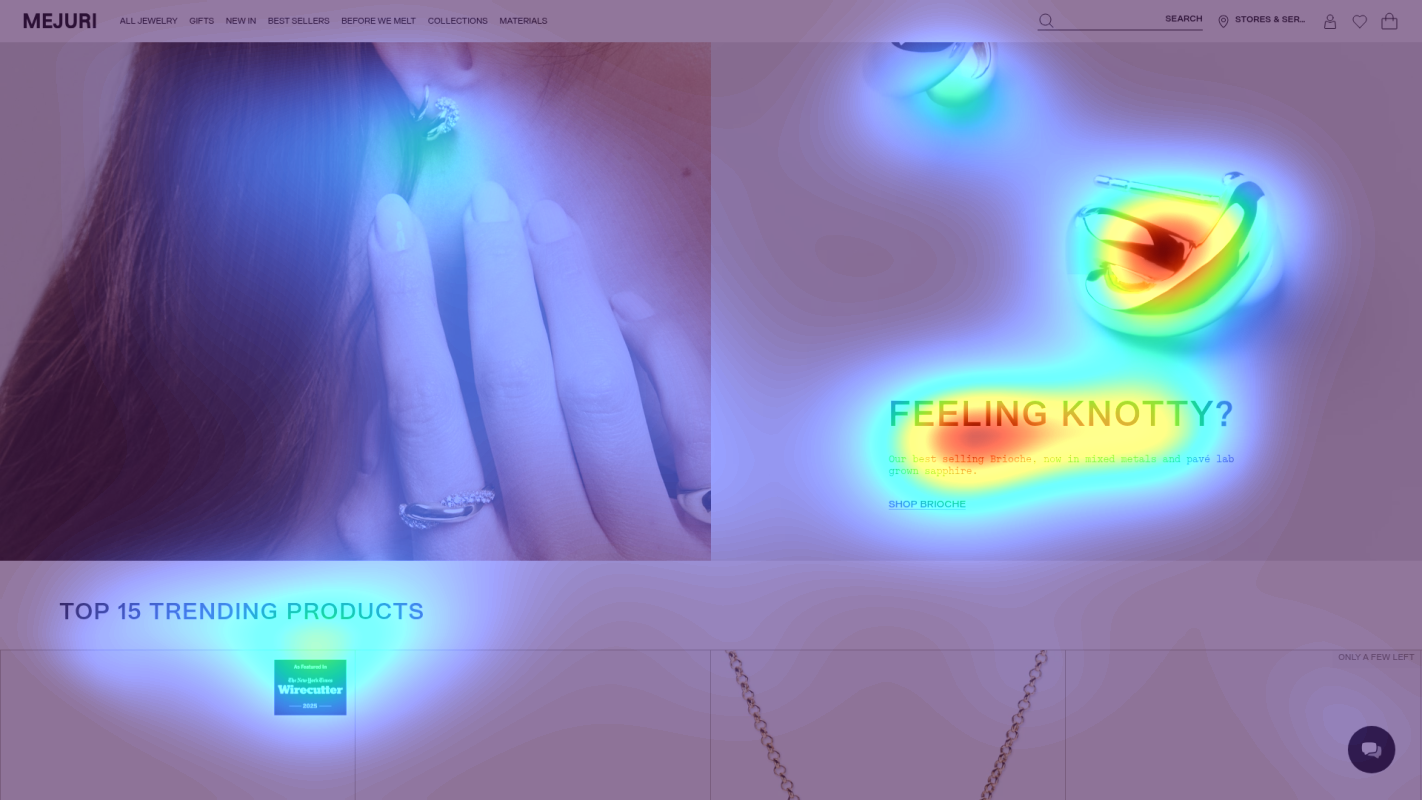
Where Mejuri's Visitors Are Actually Looking
We used AI-powered attention prediction to understand how visitors perceive your page at first glance. Red areas indicate where visitors focus their attention most.
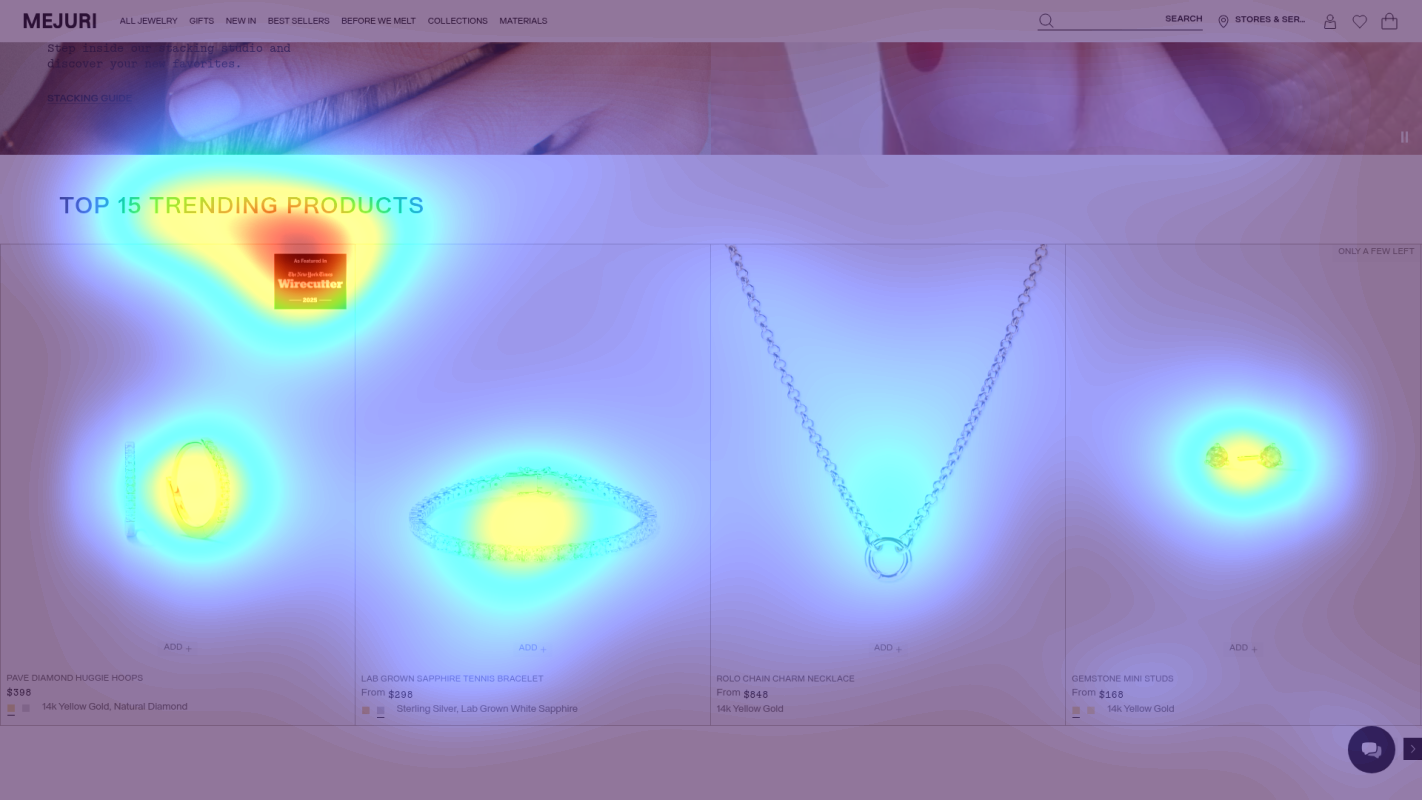
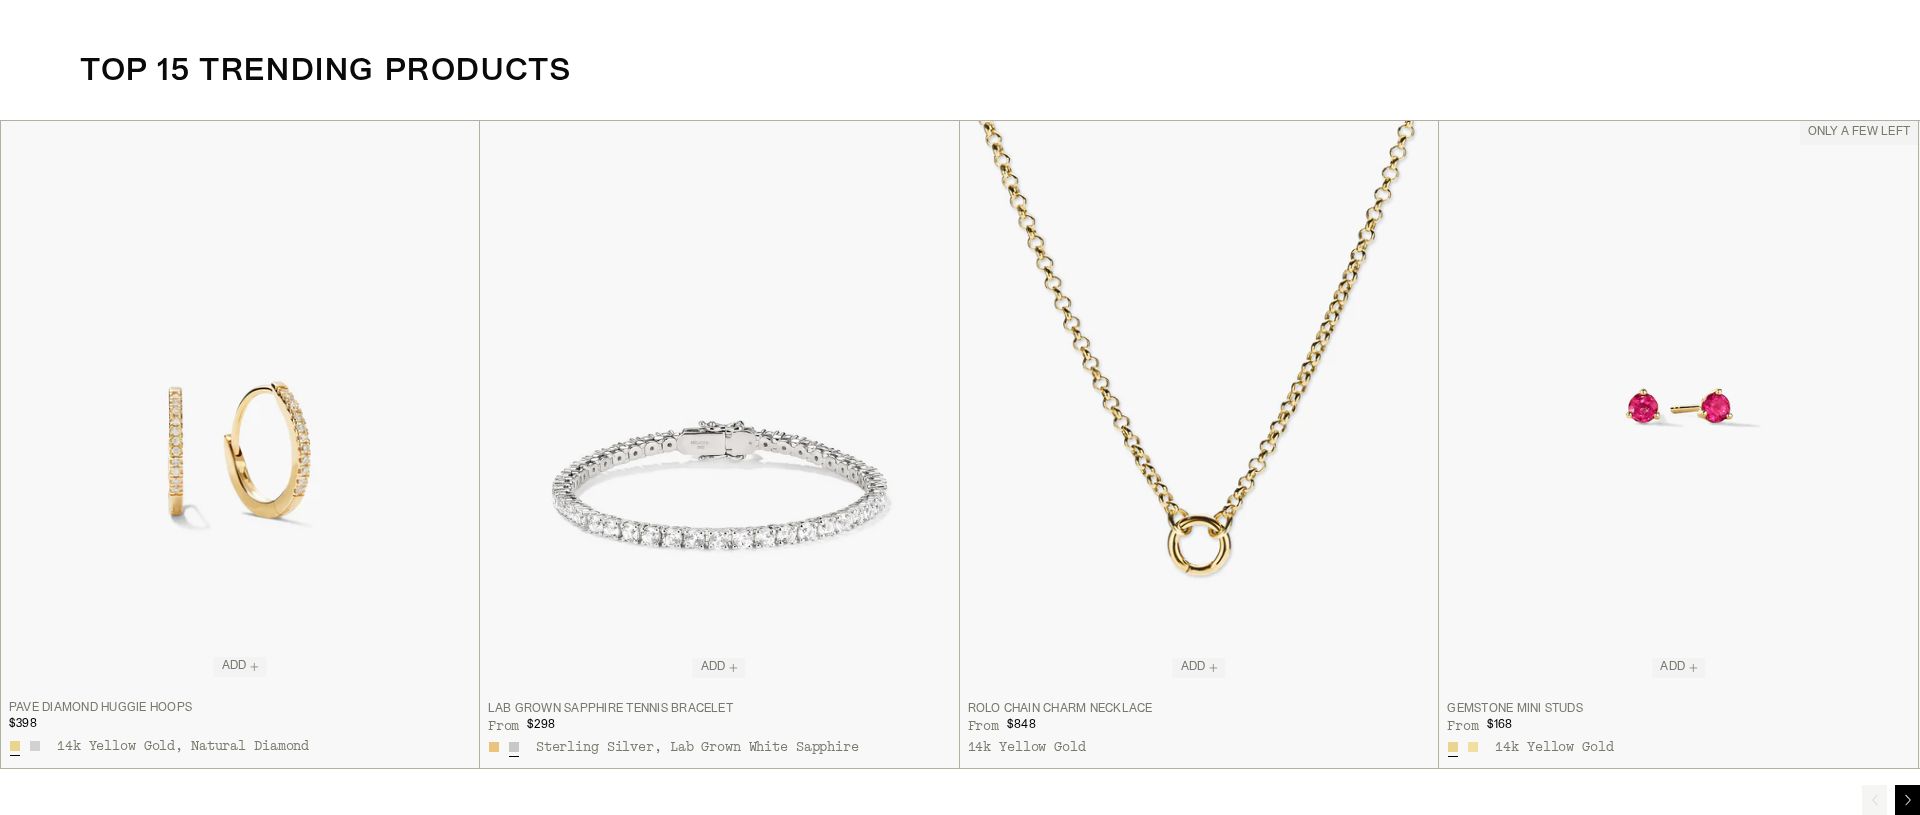
TOP 15 TRENDING PRODUCTS section
Product prices and 'ADD' buttons receiving minimal attention despite being key conversion elements
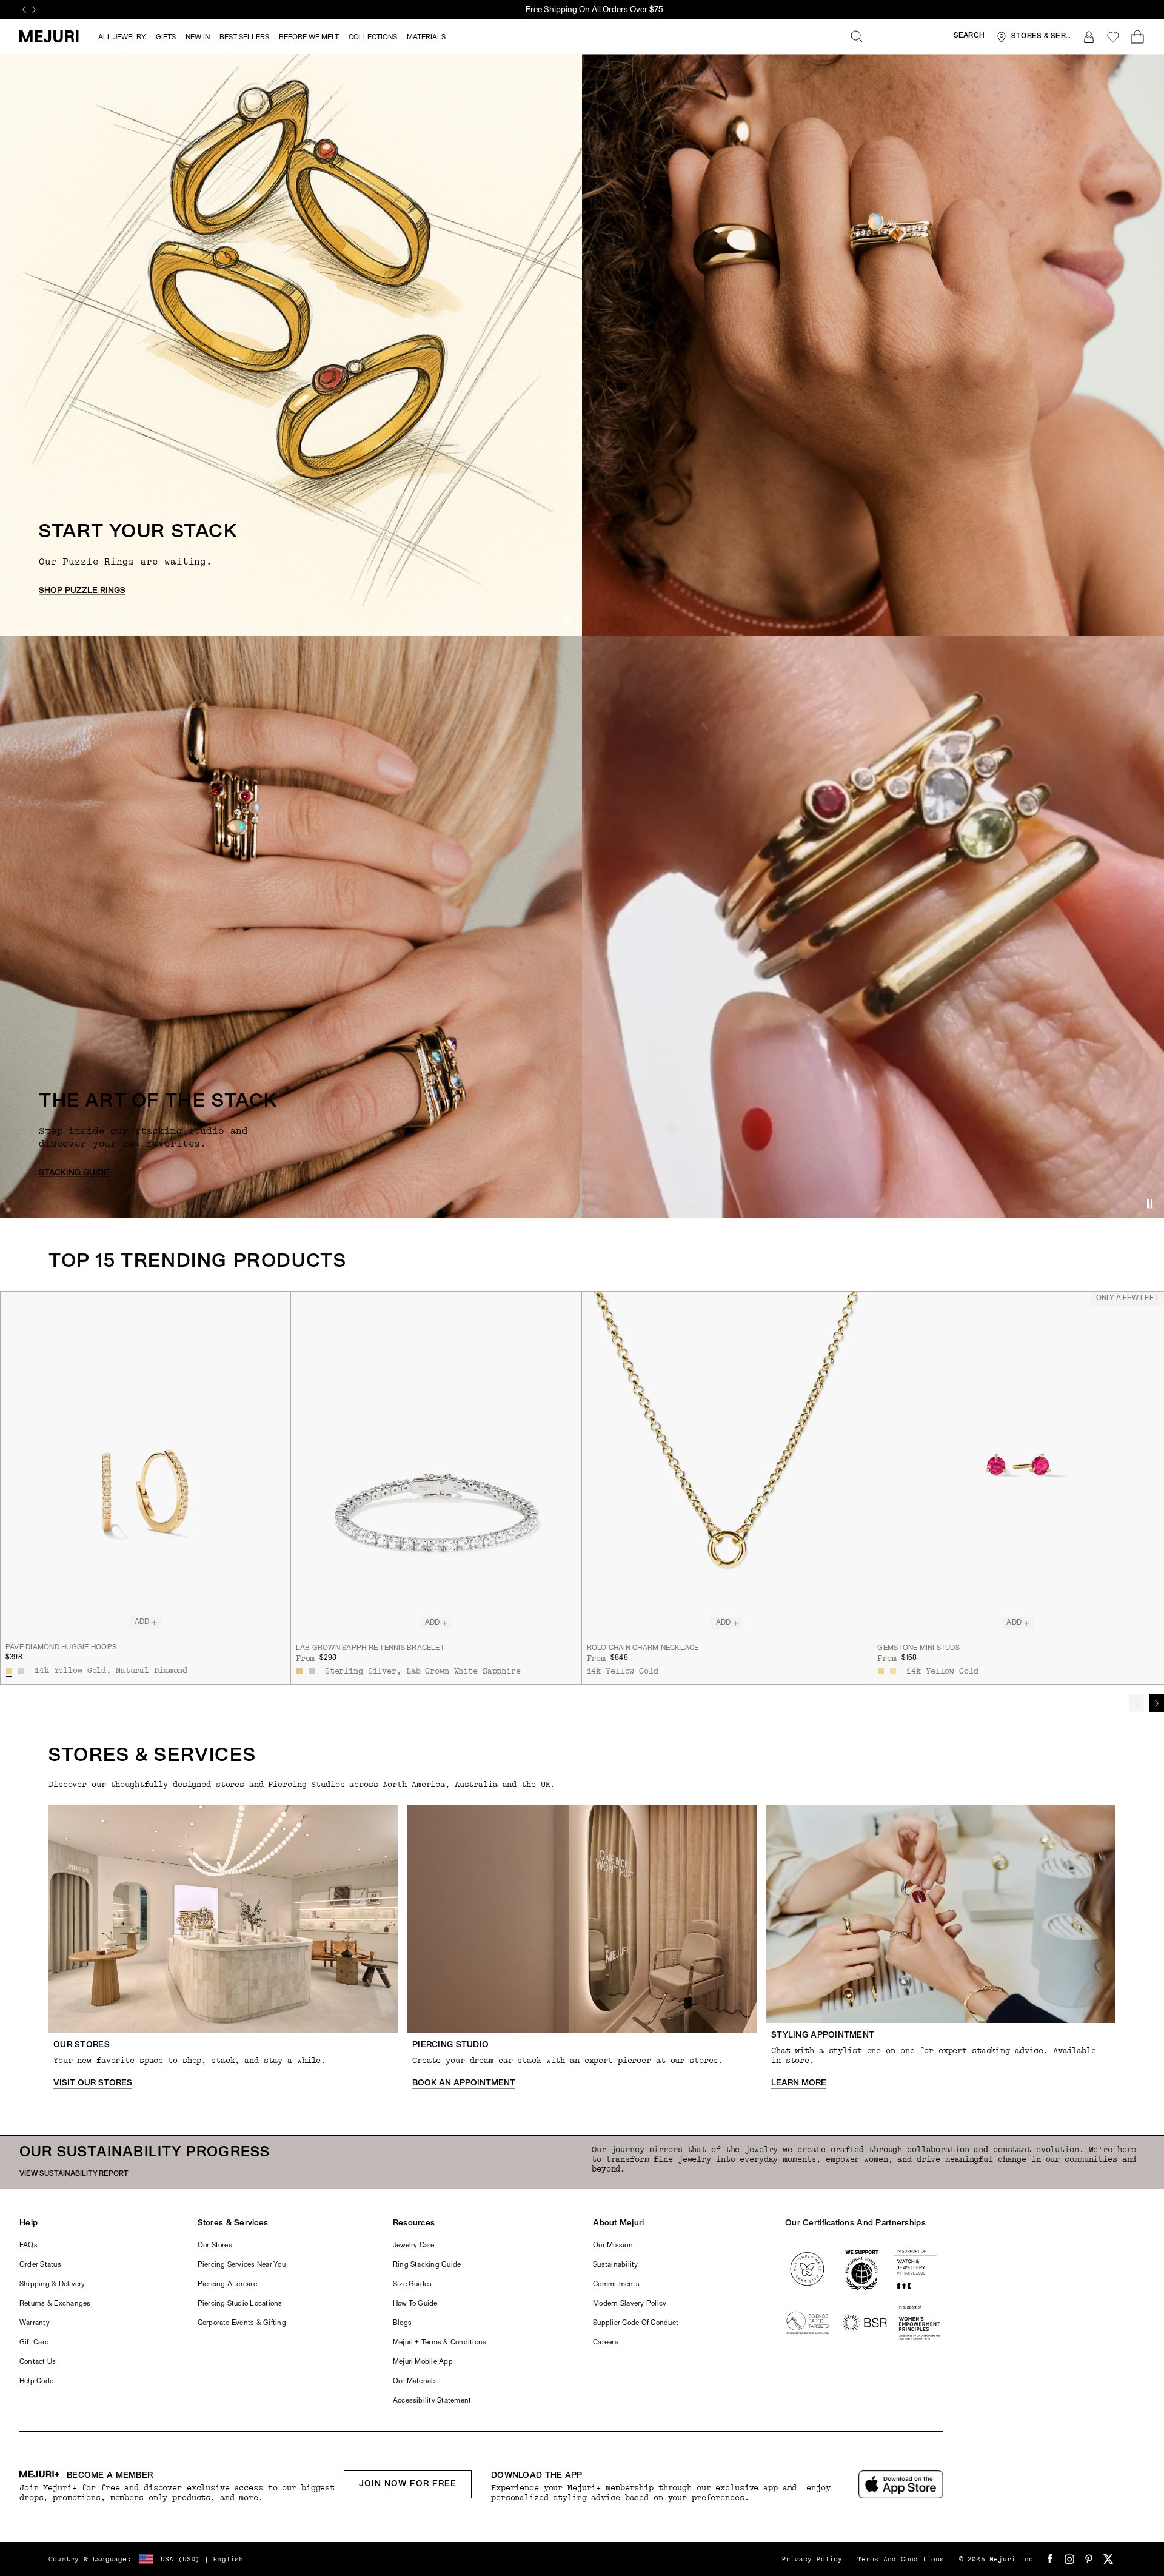
START YOUR STACK hero section
Primary CTA 'SHOP PUZZLE RINGS' receiving minimal attention in hero area
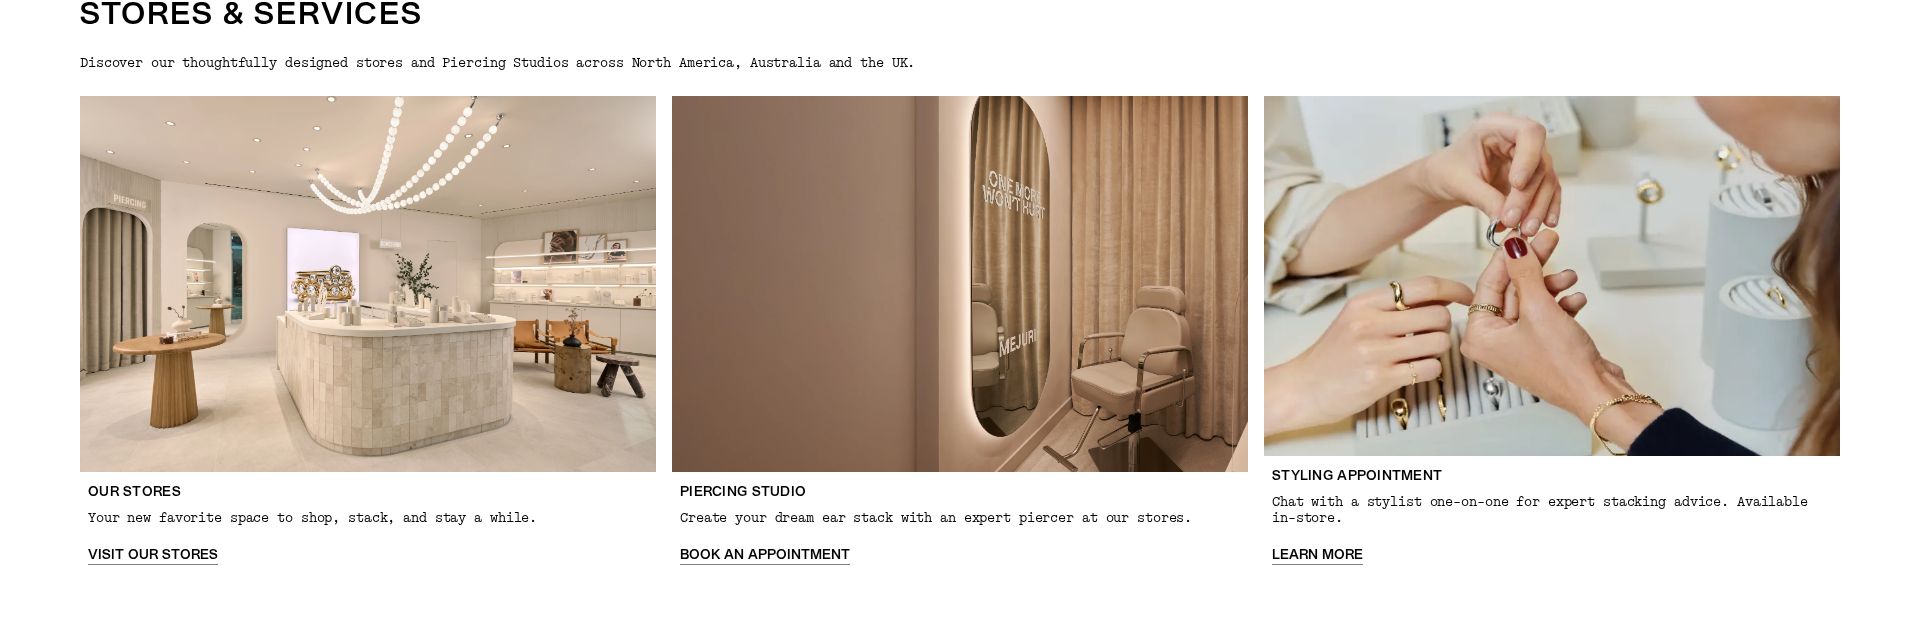
STORES & SERVICES section
Store services and appointment booking options receiving very low attention
3 Critical Issues Affecting Mejuri's Conversions
Issue: Enhance Product CTAs and Pricing Visibility
In the TOP 15 TRENDING PRODUCTS section, the ADD buttons and price displays are receiving minimal attention according to heatmap data, reducing purchase intent. The $398 price point and ADD buttons are getting lost among other product details.
Issue: Optimize Hero Section Call-to-Action
The 'SHOP PUZZLE RINGS' CTA in the START YOUR STACK hero section is receiving minimal attention per heatmap data, failing to effectively drive users into the product catalog.
Issue: Enhance Store Services Visibility
The STORES & SERVICES section is receiving very low attention according to heatmap data, causing valuable trust-building retail presence and personalized services to be overlooked.
3 Specific Changes That Could Increase Revenue by $4.3M
Recommendation 1: Enhance Product CTAs and Pricing Visibility
In the TOP 15 TRENDING PRODUCTS section, the ADD buttons and price displays are receiving minimal attention according to heatmap data, reducing purchase intent. The $398 price point and ADD buttons are getting lost among other product details.
Redesign the product cards to create stronger visual hierarchy for ADD buttons and pricing. Make ADD buttons larger with contrasting colors (potentially gold to match brand). Display prices in larger font size with increased contrast.
Making key conversion elements more visually prominent will help guide users toward purchase actions. Similar e-commerce tests show clear CTAs can increase click-through rates by 8-12%.
Recommendation 2: Optimize Hero Section Call-to-Action
The 'SHOP PUZZLE RINGS' CTA in the START YOUR STACK hero section is receiving minimal attention per heatmap data, failing to effectively drive users into the product catalog.
Redesign hero section with larger, more prominent CTA button and add compelling benefit statement. Use contrasting colors and create clearer visual hierarchy leading to the CTA.
A more prominent and benefit-focused hero CTA typically increases click-through rates by 8-15% by better capturing initial user attention and communicating value.

Recommendation 3: Enhance Store Services Visibility
The STORES & SERVICES section is receiving very low attention according to heatmap data, causing valuable trust-building retail presence and personalized services to be overlooked.
Add social proof elements and lifestyle imagery showing in-store experiences. Include key statistics and customer testimonials about the styling and piercing services.
Adding social proof and visual evidence of in-person services can increase appointment bookings by 8-10% by building trust and showing real value of services.
Combined Impact: Here's What Mejuri Could Achieve
A conservative projection based on our methodology
Breakdown by Change
- Enhance Product CTAs and Pricing Visibility $127.5K/mo
- Optimize Hero Section Call-to-Action $127.5K/mo
- Enhance Store Services Visibility $105.0K/mo
How Mejuri Would Work With The Good
Our approach lets your team validate our methods before a larger digital experience investment.
Discovery & Baseline
Deep-dive into your analytics and user behavior
Goal Setting
Define success metrics and KPIs
Sprint Planning
Prioritize tests by impact and effort
A/B Testing
Execute, measure, and iterate
Ready to Capture That $4.3M in Revenue?
This is an initial AI-driven assessment to illustrate revenue potential. The next step is a comprehensive optimization program built for you. Every optimization program starts with a digital experience audit. During the audit our team of experts:
- Conducts in-depth user research and analytics review
- Performs heuristic evaluation of your complete funnel
- Identifies the biggest conversion barriers and opportunities in your digital experience
- Creates a prioritized roadmap based on impact and effort
Why Mejuri Should Trust This Analysis
16+ Years Optimization Work
We've optimized hundreds of millions in revenue through our optimization programs.
Fortune 500 Clients
Worked with leading companies including Nike, Adobe, and Xerox.
Data-Driven Methodology
Our analysis is based on thousands of successful A/B tests across industries.