5-Minute Website Assessment Based on 16+ Years of Optimization Data
Revenue Opportunities Hidden in
Mejuri's User Experience
3 Free Data-Backed Website Optimization Opportunities
We analyzed Mejuri's digital experience using our proprietary database of 2,000+ tests, 10,000+ research data points, proprietary frameworks, and initial research methods. Now we've identified $4.3M in potential revenue improvements.
Our Methodology

To create this analysis, we:
- Analyzed your website's user experience patterns
- Compared against 200+ similar Retail - Jewelry companies in our database
- Applied our DXO Heuristics framework
- Generated real-time heatmap data
- Cross-referenced with test results from past clients facing similar challenges
How we calculate revenue projections
Revenue projections are calculated using public estimates of your annual revenue, the conversion contribution of each page type, historical lift percentages from our database of thousands of experiments, and a confidence multiplier based on evidence strength. Total projected impact is capped at a percent of annual revenue to ensure conservative estimates.
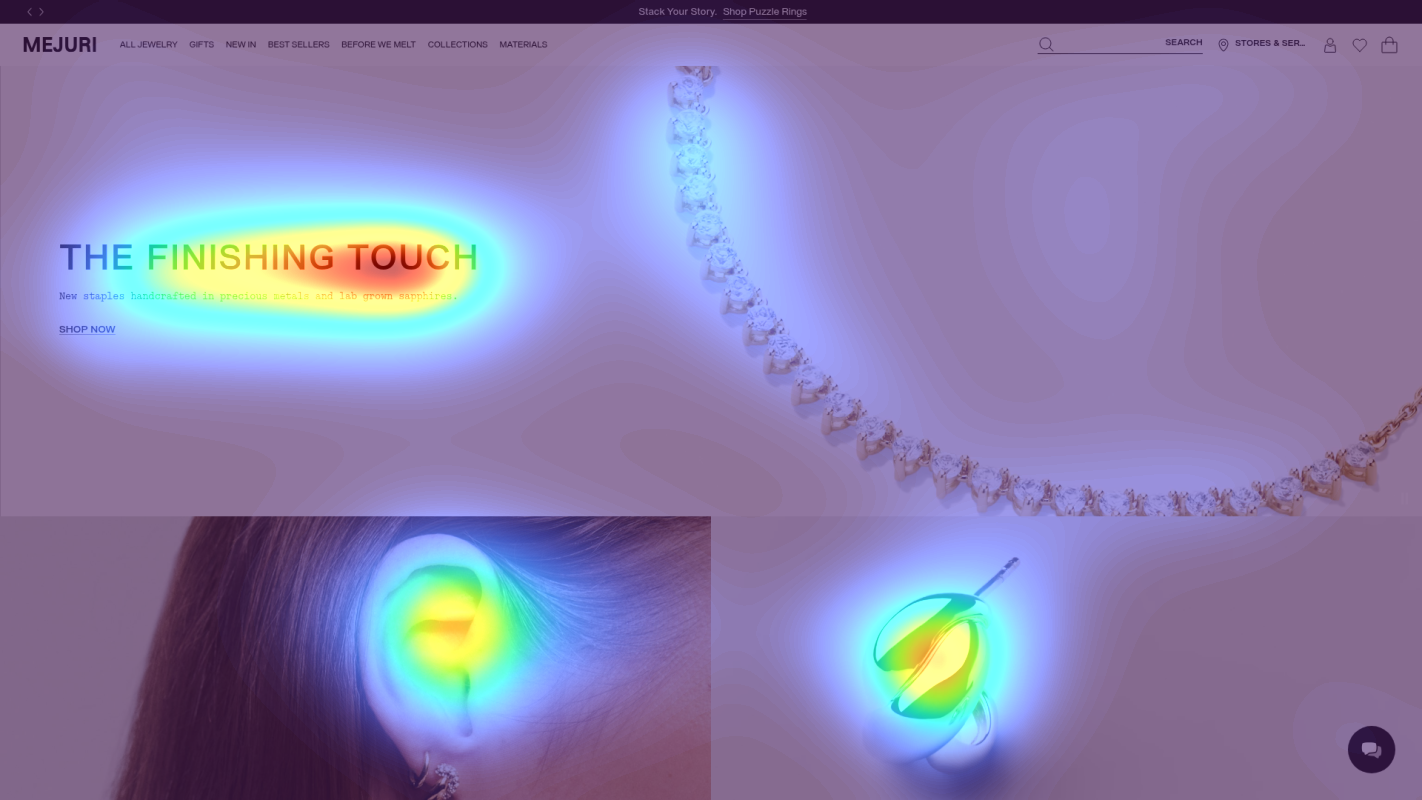
Where Mejuri's Visitors Are Actually Looking
We used AI-powered attention prediction to understand how visitors perceive your page at first glance. Red areas indicate where visitors focus their attention most.
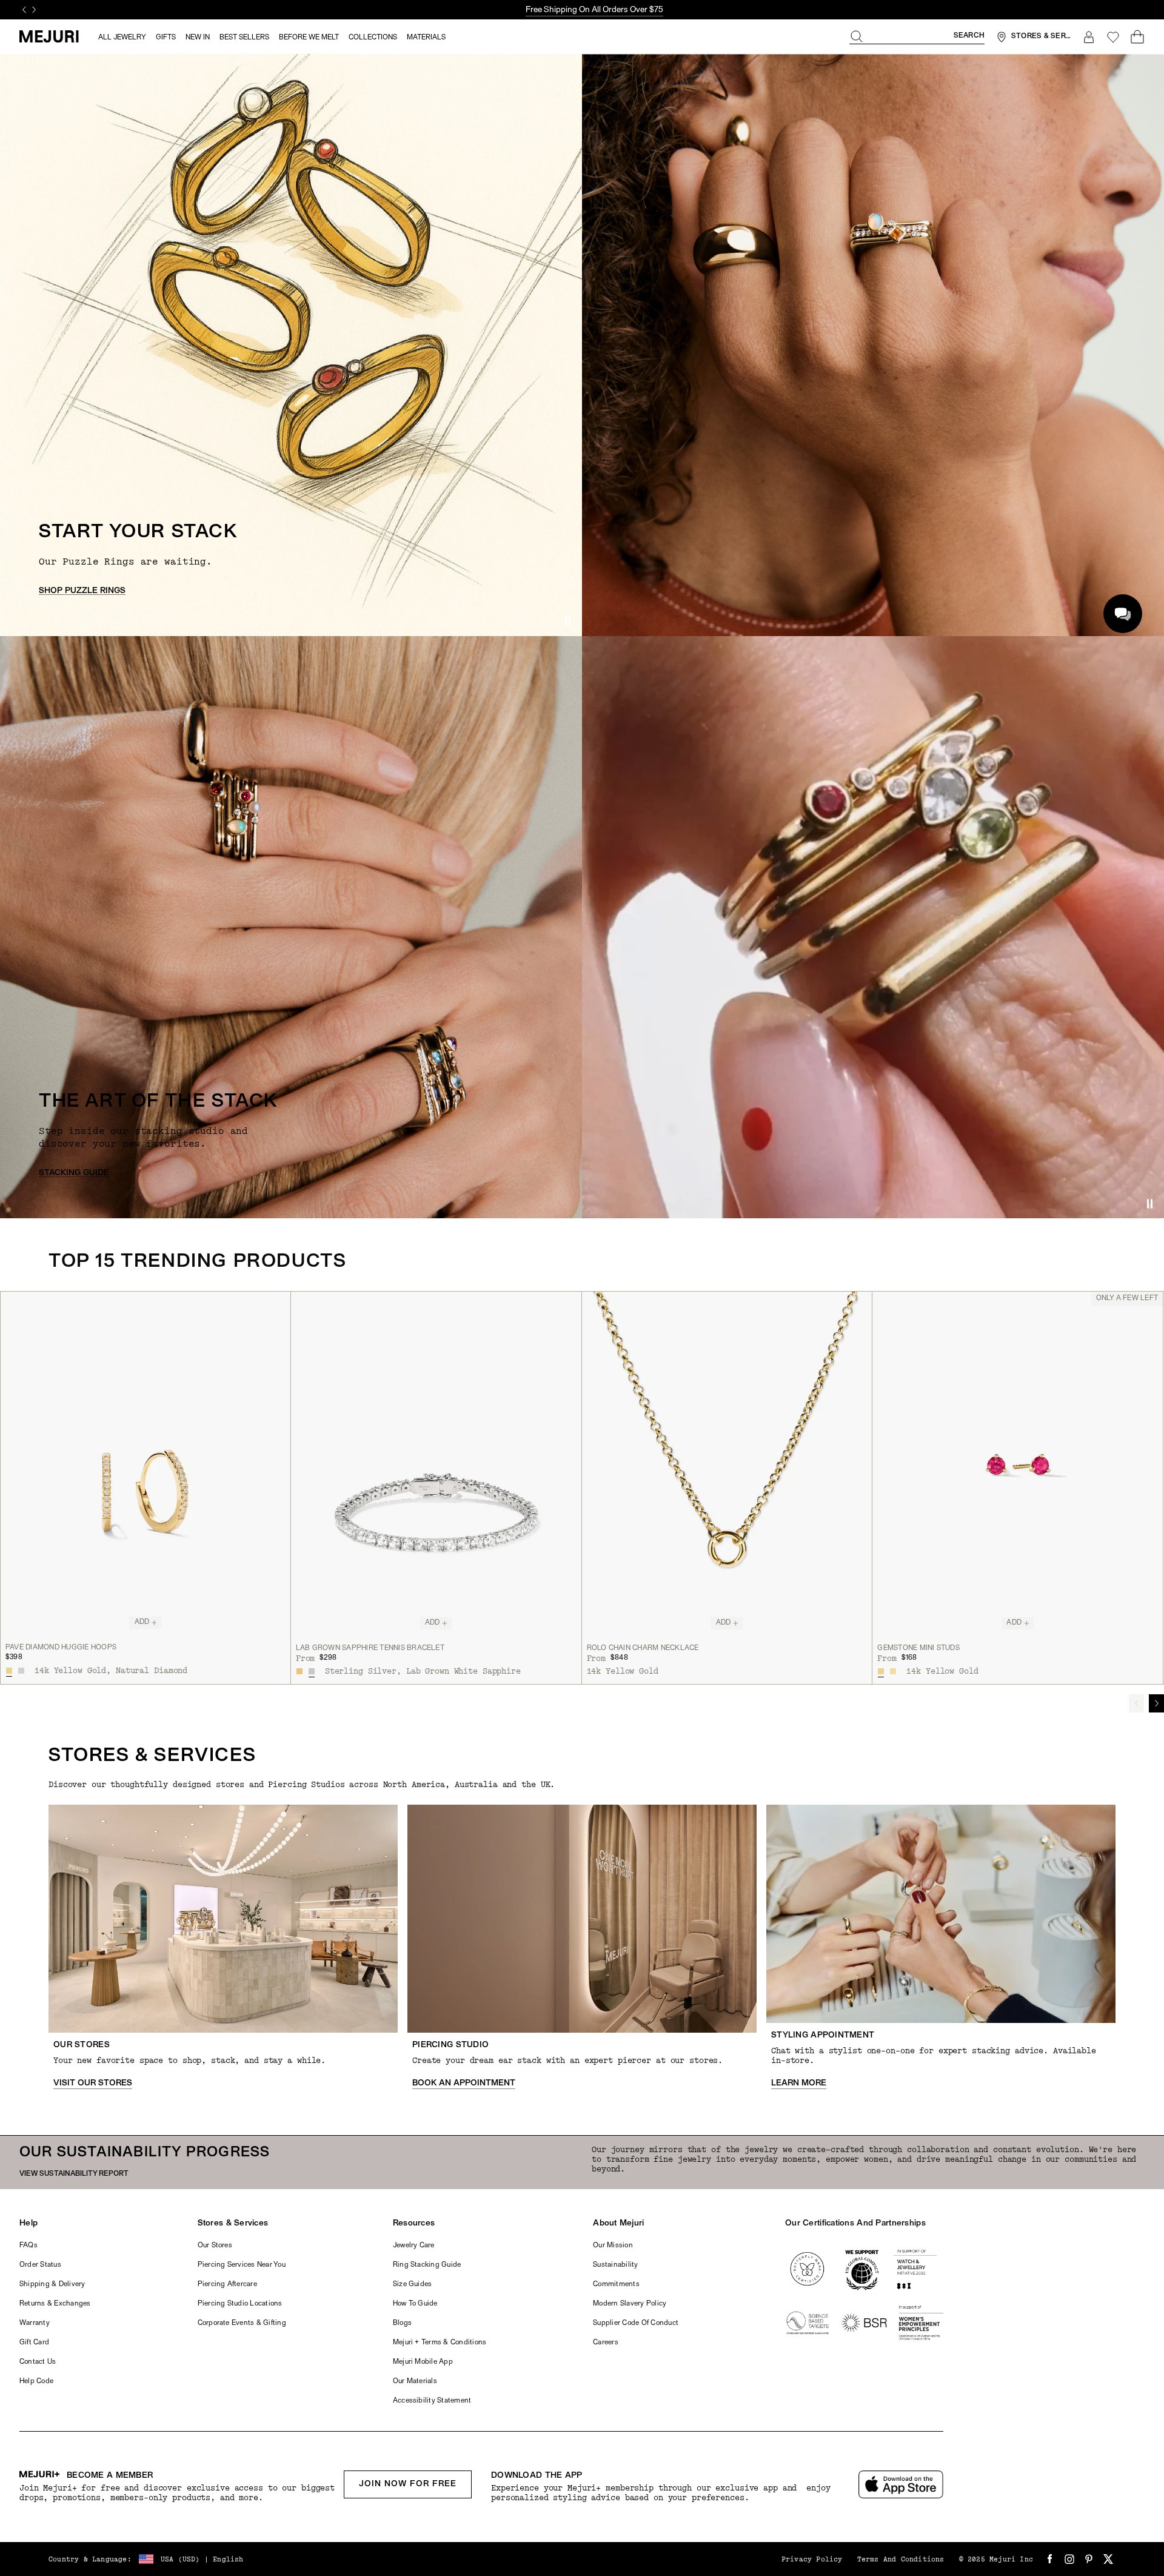
Main hero banner
The sustainability messaging receives moderate attention but fails to connect directly with purchase motivation
Navigation menu
Navigation menu items are receiving disproportionately high attention compared to conversion elements
Trust badges section
Certification badges and partnership logos receive minimal attention in their current placement
3 Critical Issues Affecting Mejuri's Conversions
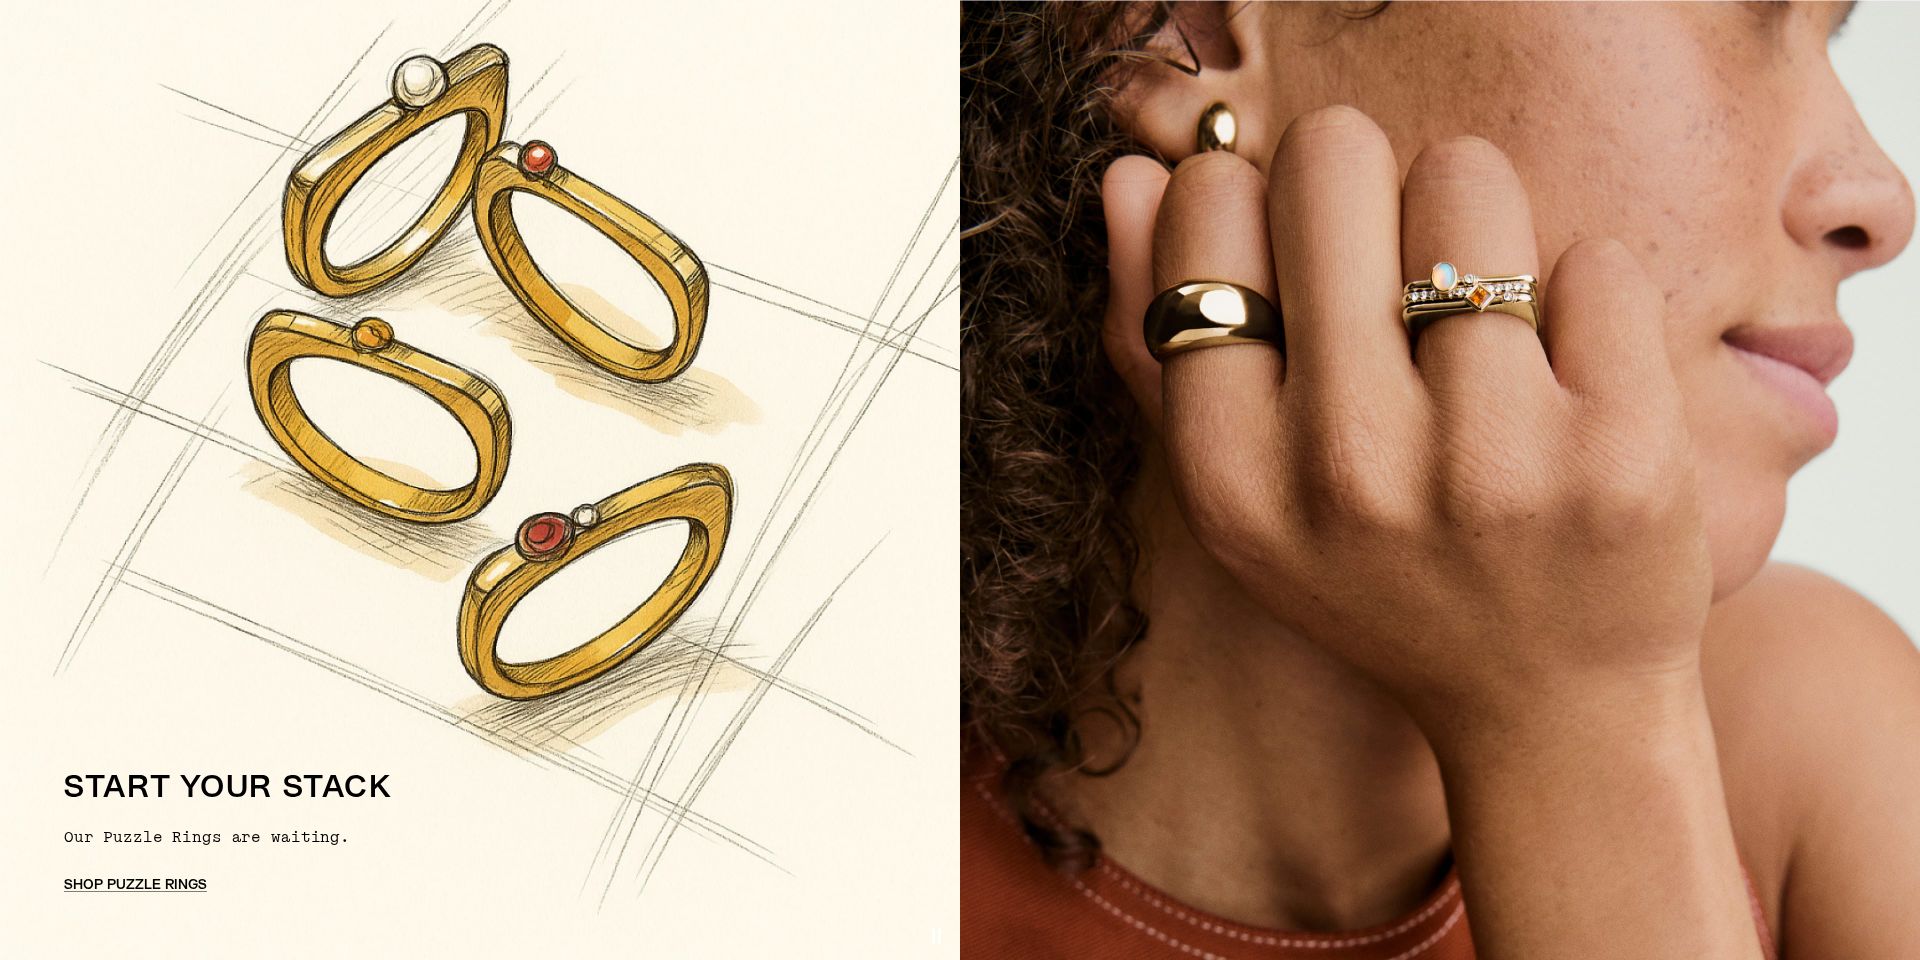
Issue: Enhance 'START YOUR STACK' Section with Clear Product Benefits
The 'START YOUR STACK' section lacks clear product benefits and value proposition, with heatmap showing users spending excessive time on navigation instead of engaging with the featured Puzzle Rings offer
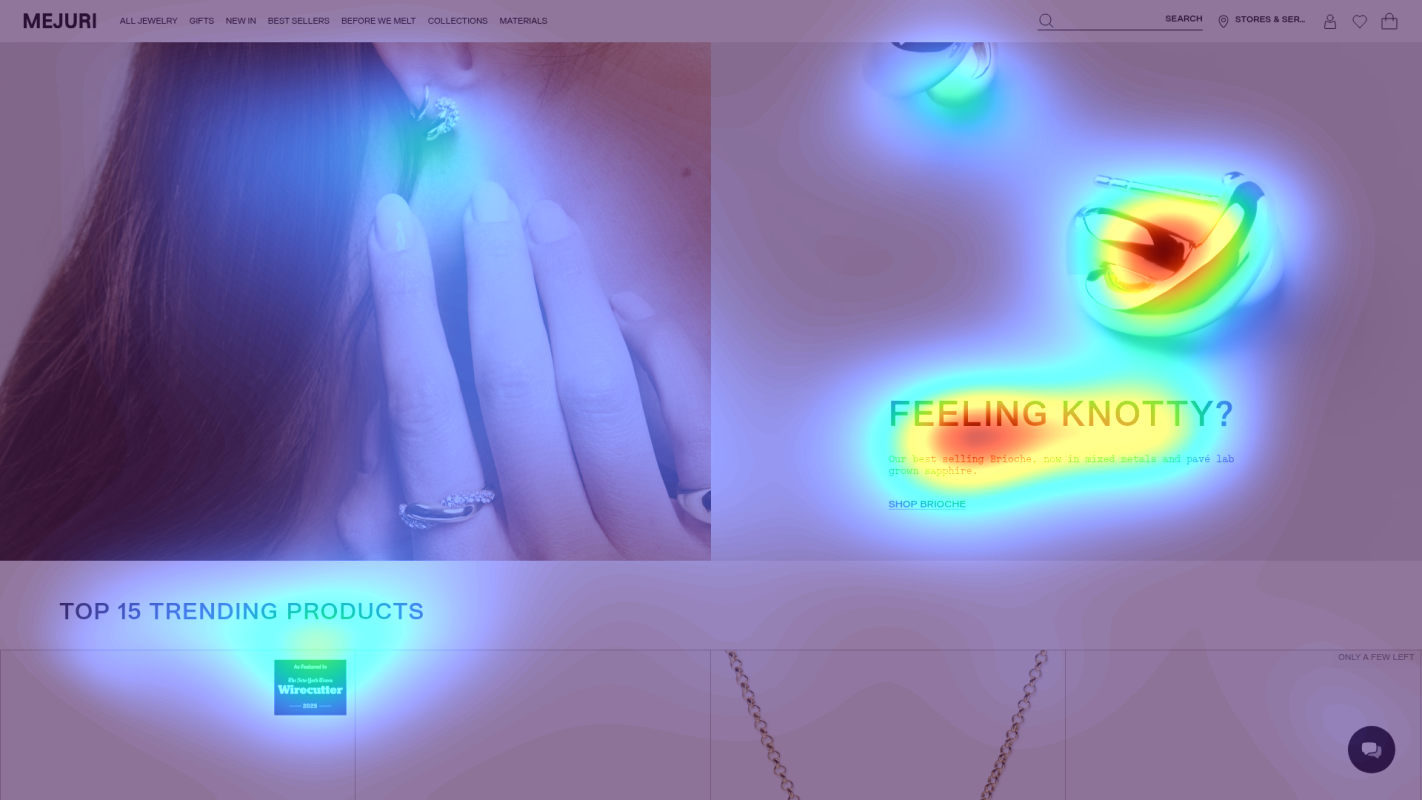
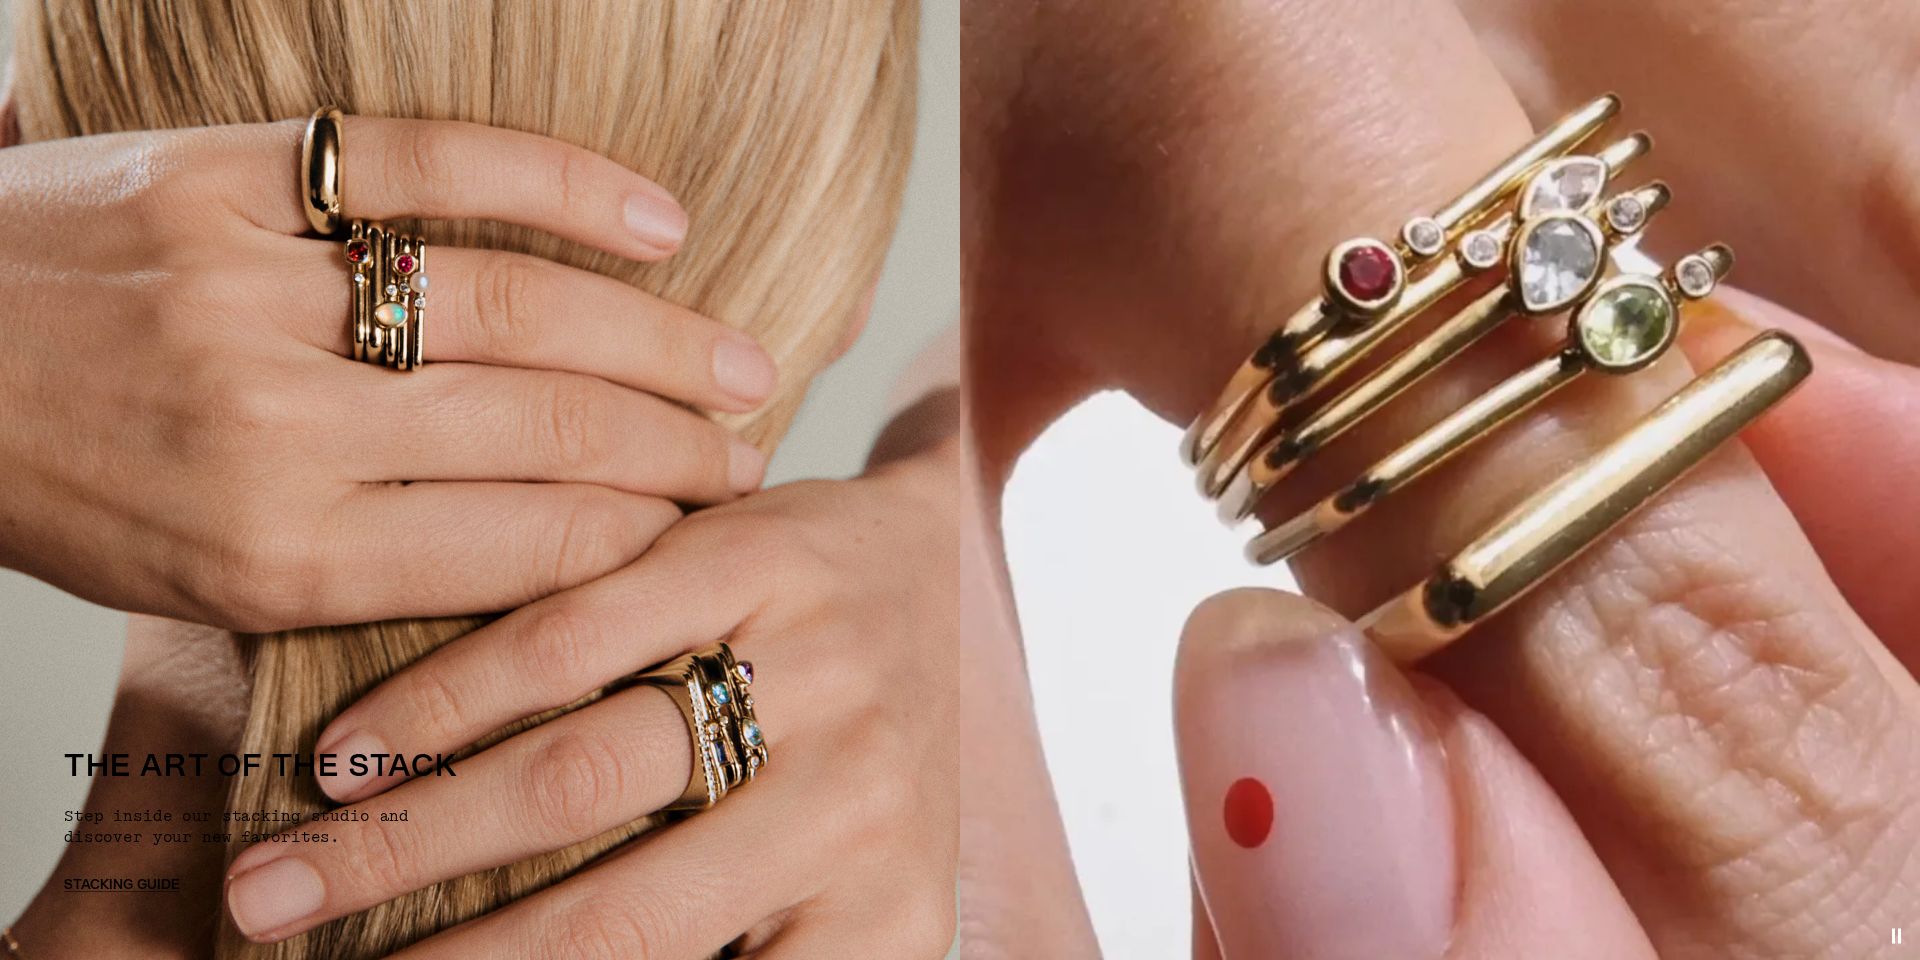
Issue: Optimize Stacking Guide Section for Better Conversion
The 'THE ART OF THE STACK' section receives scattered attention without clear next steps, failing to effectively guide users through the product discovery process
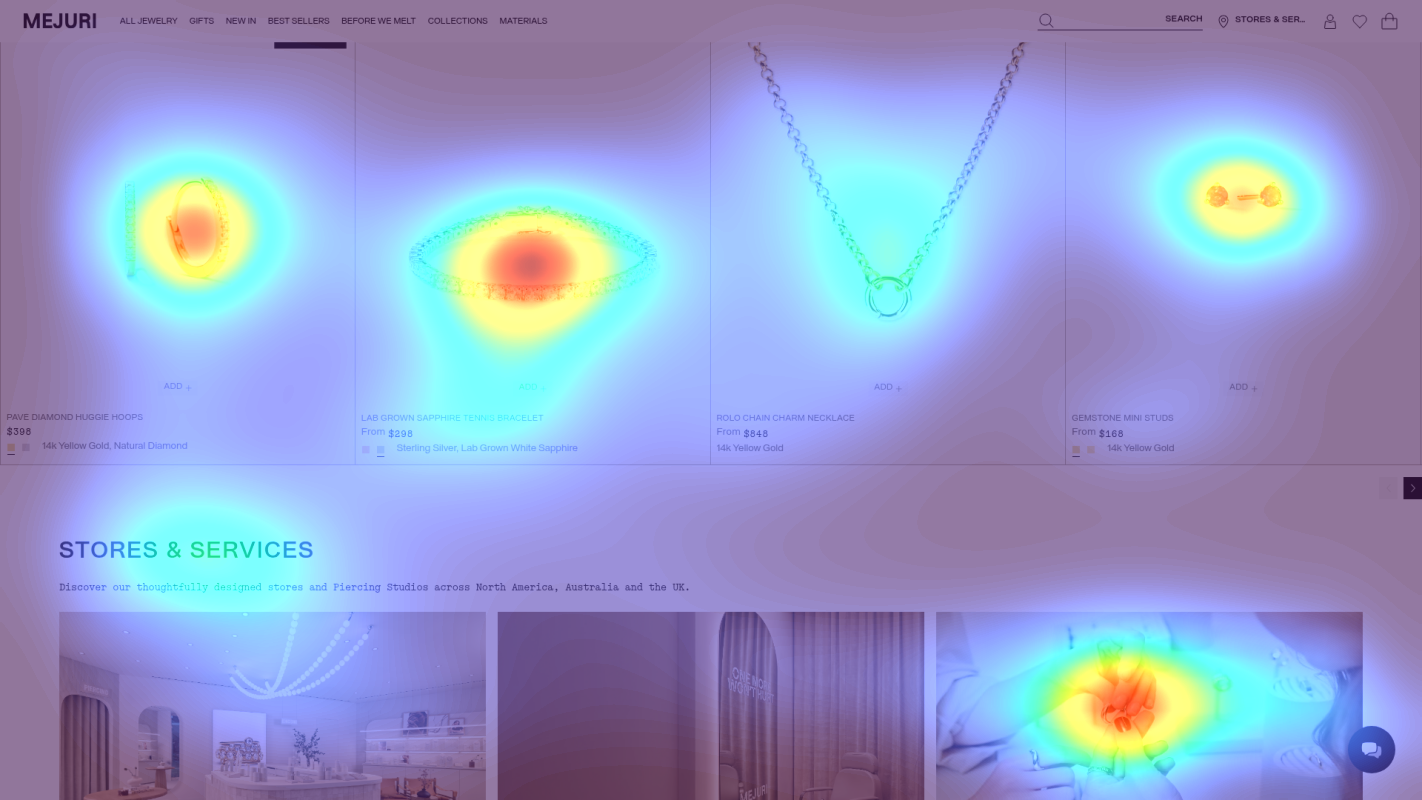
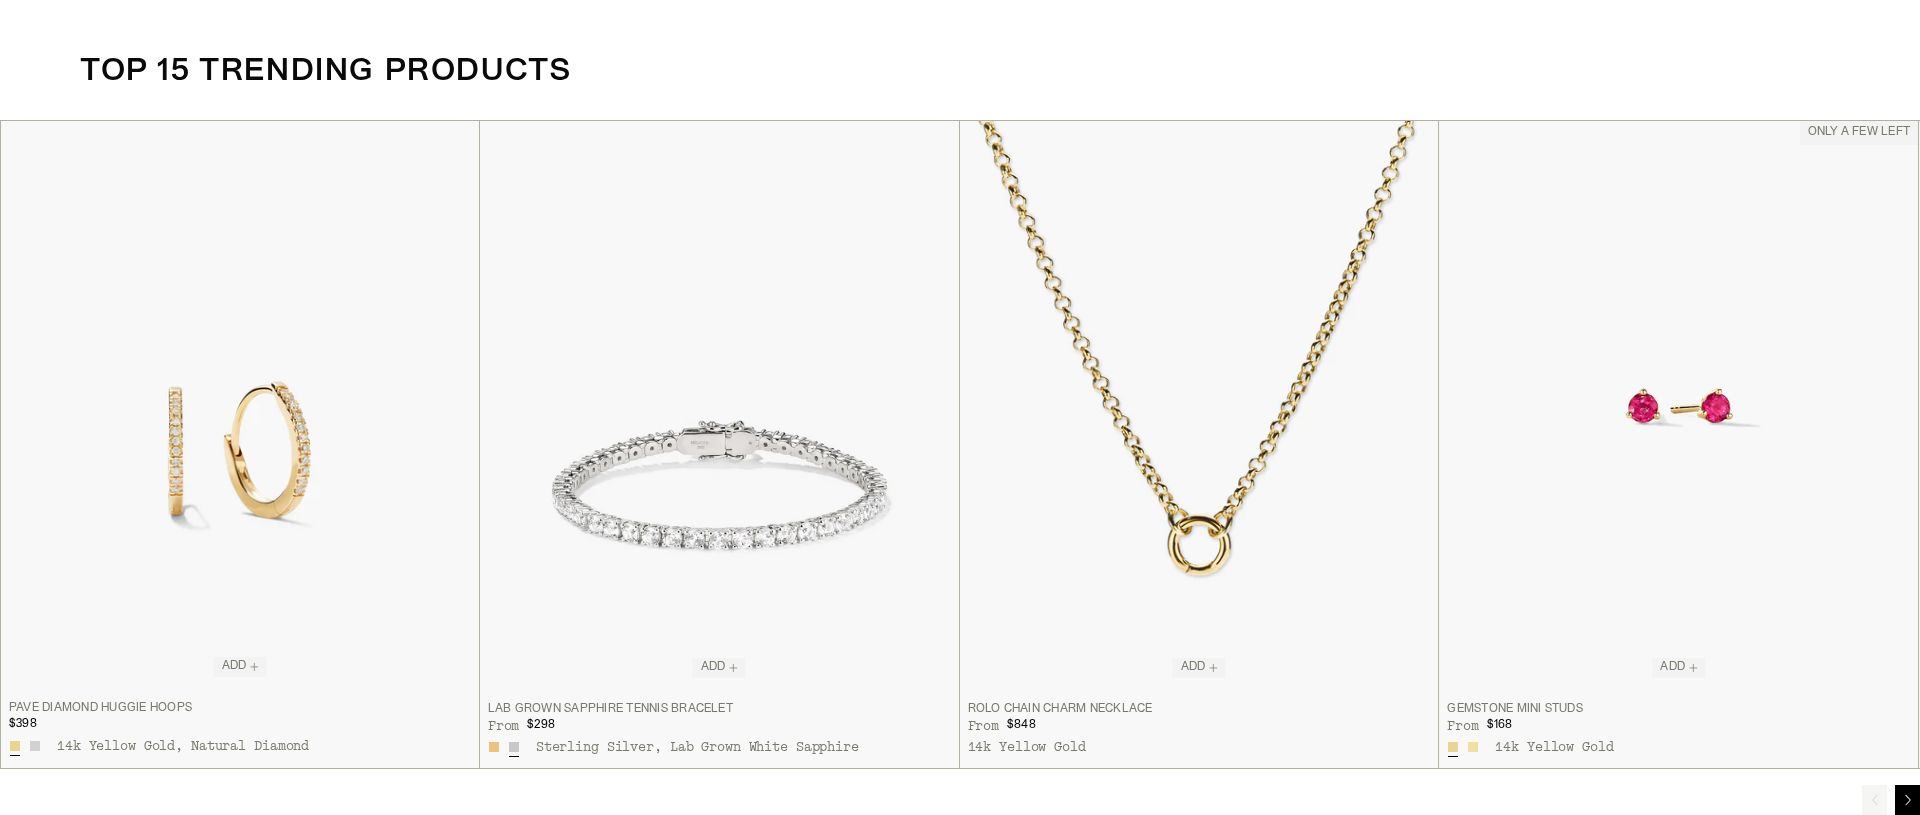
Issue: Enhance Top Products Section with Trust Signals
The 'TOP 15 TRENDING PRODUCTS' section lacks prominent trust indicators, with heatmap showing minimal attention on certification badges that could boost purchase confidence
3 Specific Changes That Could Increase Revenue by $4.3M
Recommendation 1: Enhance 'START YOUR STACK' Section with Clear Product Benefits
The 'START YOUR STACK' section lacks clear product benefits and value proposition, with heatmap showing users spending excessive time on navigation instead of engaging with the featured Puzzle Rings offer
Restructure the 'START YOUR STACK' section to lead with specific product benefits and create a more compelling CTA. Change heading to 'CREATE YOUR UNIQUE STACK' and add benefit-focused subheading: 'Mix & Match Puzzle Rings from $X - Designed to Stack Perfectly'. Add a prominent 'SHOP NOW' button with urgency indicator.
Leading with clear product benefits and value proposition will help convert navigation attention into product engagement. Adding price point and uniqueness messaging addresses purchase hesitation directly.
Recommendation 2: Optimize Stacking Guide Section for Better Conversion
The 'THE ART OF THE STACK' section receives scattered attention without clear next steps, failing to effectively guide users through the product discovery process
Transform the stacking guide section into an interactive product discovery tool. Add visual preview of popular stacks with prices, and include a 'Start Your Stack' quiz button. Include trust indicators showing '1000+ 5-star stack reviews'.
An interactive approach with social proof will better engage users and provide clear direction for product exploration, addressing the current scattered attention pattern
Recommendation 3: Enhance Top Products Section with Trust Signals
The 'TOP 15 TRENDING PRODUCTS' section lacks prominent trust indicators, with heatmap showing minimal attention on certification badges that could boost purchase confidence
Integrate trust signals directly into the product grid. Add 'Certified Sustainable' badge next to each price, include '100% Authentic' guarantee below prices, and show real-time inventory status ('Only X Left') for urgent items.
Adding trust signals near product prices will boost purchase confidence for high-value jewelry items and create urgency
Combined Impact: Here's What Mejuri Could Achieve
A conservative projection based on our methodology
Breakdown by Change
- Enhance 'START YOUR STACK' Section with Clear Product Benefits $127.5K/mo
- Optimize Stacking Guide Section for Better Conversion $105.0K/mo
- Enhance Top Products Section with Trust Signals $127.5K/mo
How Mejuri Would Work With The Good
Our approach lets your team validate our methods before a larger digital experience investment.
Discovery & Baseline
Deep-dive into your analytics and user behavior
Goal Setting
Define success metrics and KPIs
Sprint Planning
Prioritize tests by impact and effort
A/B Testing
Execute, measure, and iterate
Ready to Capture That $4.3M in Revenue?
This is an initial AI-driven assessment to illustrate revenue potential. The next step is a comprehensive optimization program built for you. Every optimization program starts with a digital experience audit. During the audit our team of experts:
- Conducts in-depth user research and analytics review
- Performs heuristic evaluation of your complete funnel
- Identifies the biggest conversion barriers and opportunities in your digital experience
- Creates a prioritized roadmap based on impact and effort
Why Mejuri Should Trust This Analysis
16+ Years Optimization Work
We've optimized hundreds of millions in revenue through our optimization programs.
Fortune 500 Clients
Worked with leading companies including Nike, Adobe, and Xerox.
Data-Driven Methodology
Our analysis is based on thousands of successful A/B tests across industries.