5-Minute Website Assessment Based on 16+ Years of Optimization Data
Revenue Opportunities Hidden in
Mejuri's User Experience
3 Free Data-Backed Website Optimization Opportunities
We analyzed Mejuri's digital experience using our proprietary database of 2,000+ tests, 10,000+ research data points, proprietary frameworks, and initial research methods. Now we've identified $4.3M in potential revenue improvements.
Our Methodology

To create this analysis, we:
- Analyzed your website's user experience patterns
- Compared against 200+ similar Retail - Fine Jewelry companies in our database
- Applied our DXO Heuristics framework
- Generated real-time heatmap data
- Cross-referenced with test results from past clients facing similar challenges
How we calculate revenue projections
Revenue projections are calculated using public estimates of your annual revenue, the conversion contribution of each page type, historical lift percentages from our database of thousands of experiments, and a confidence multiplier based on evidence strength. Total projected impact is capped at a percent of annual revenue to ensure conservative estimates.
Where Mejuri's Visitors Are Actually Looking
We used AI-powered attention prediction to understand how visitors perceive your page at first glance. Red areas indicate where visitors focus their attention most.
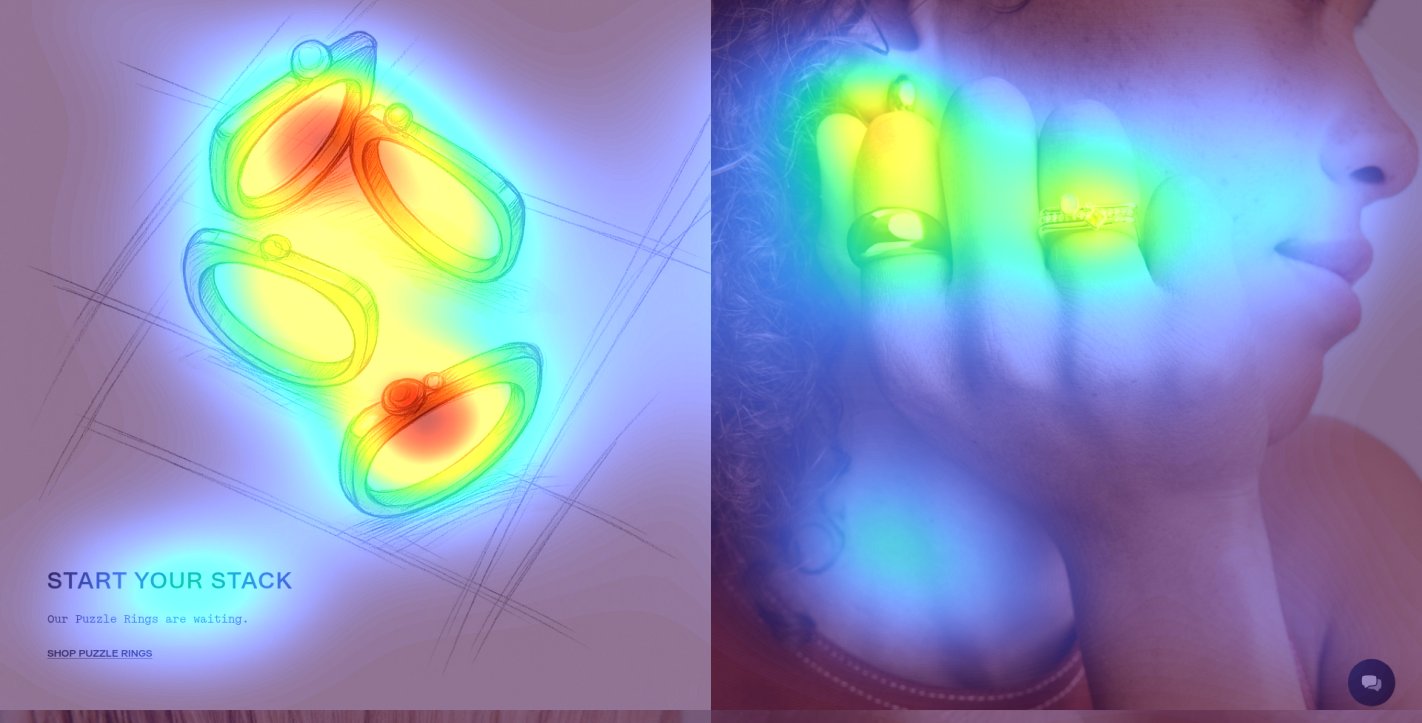
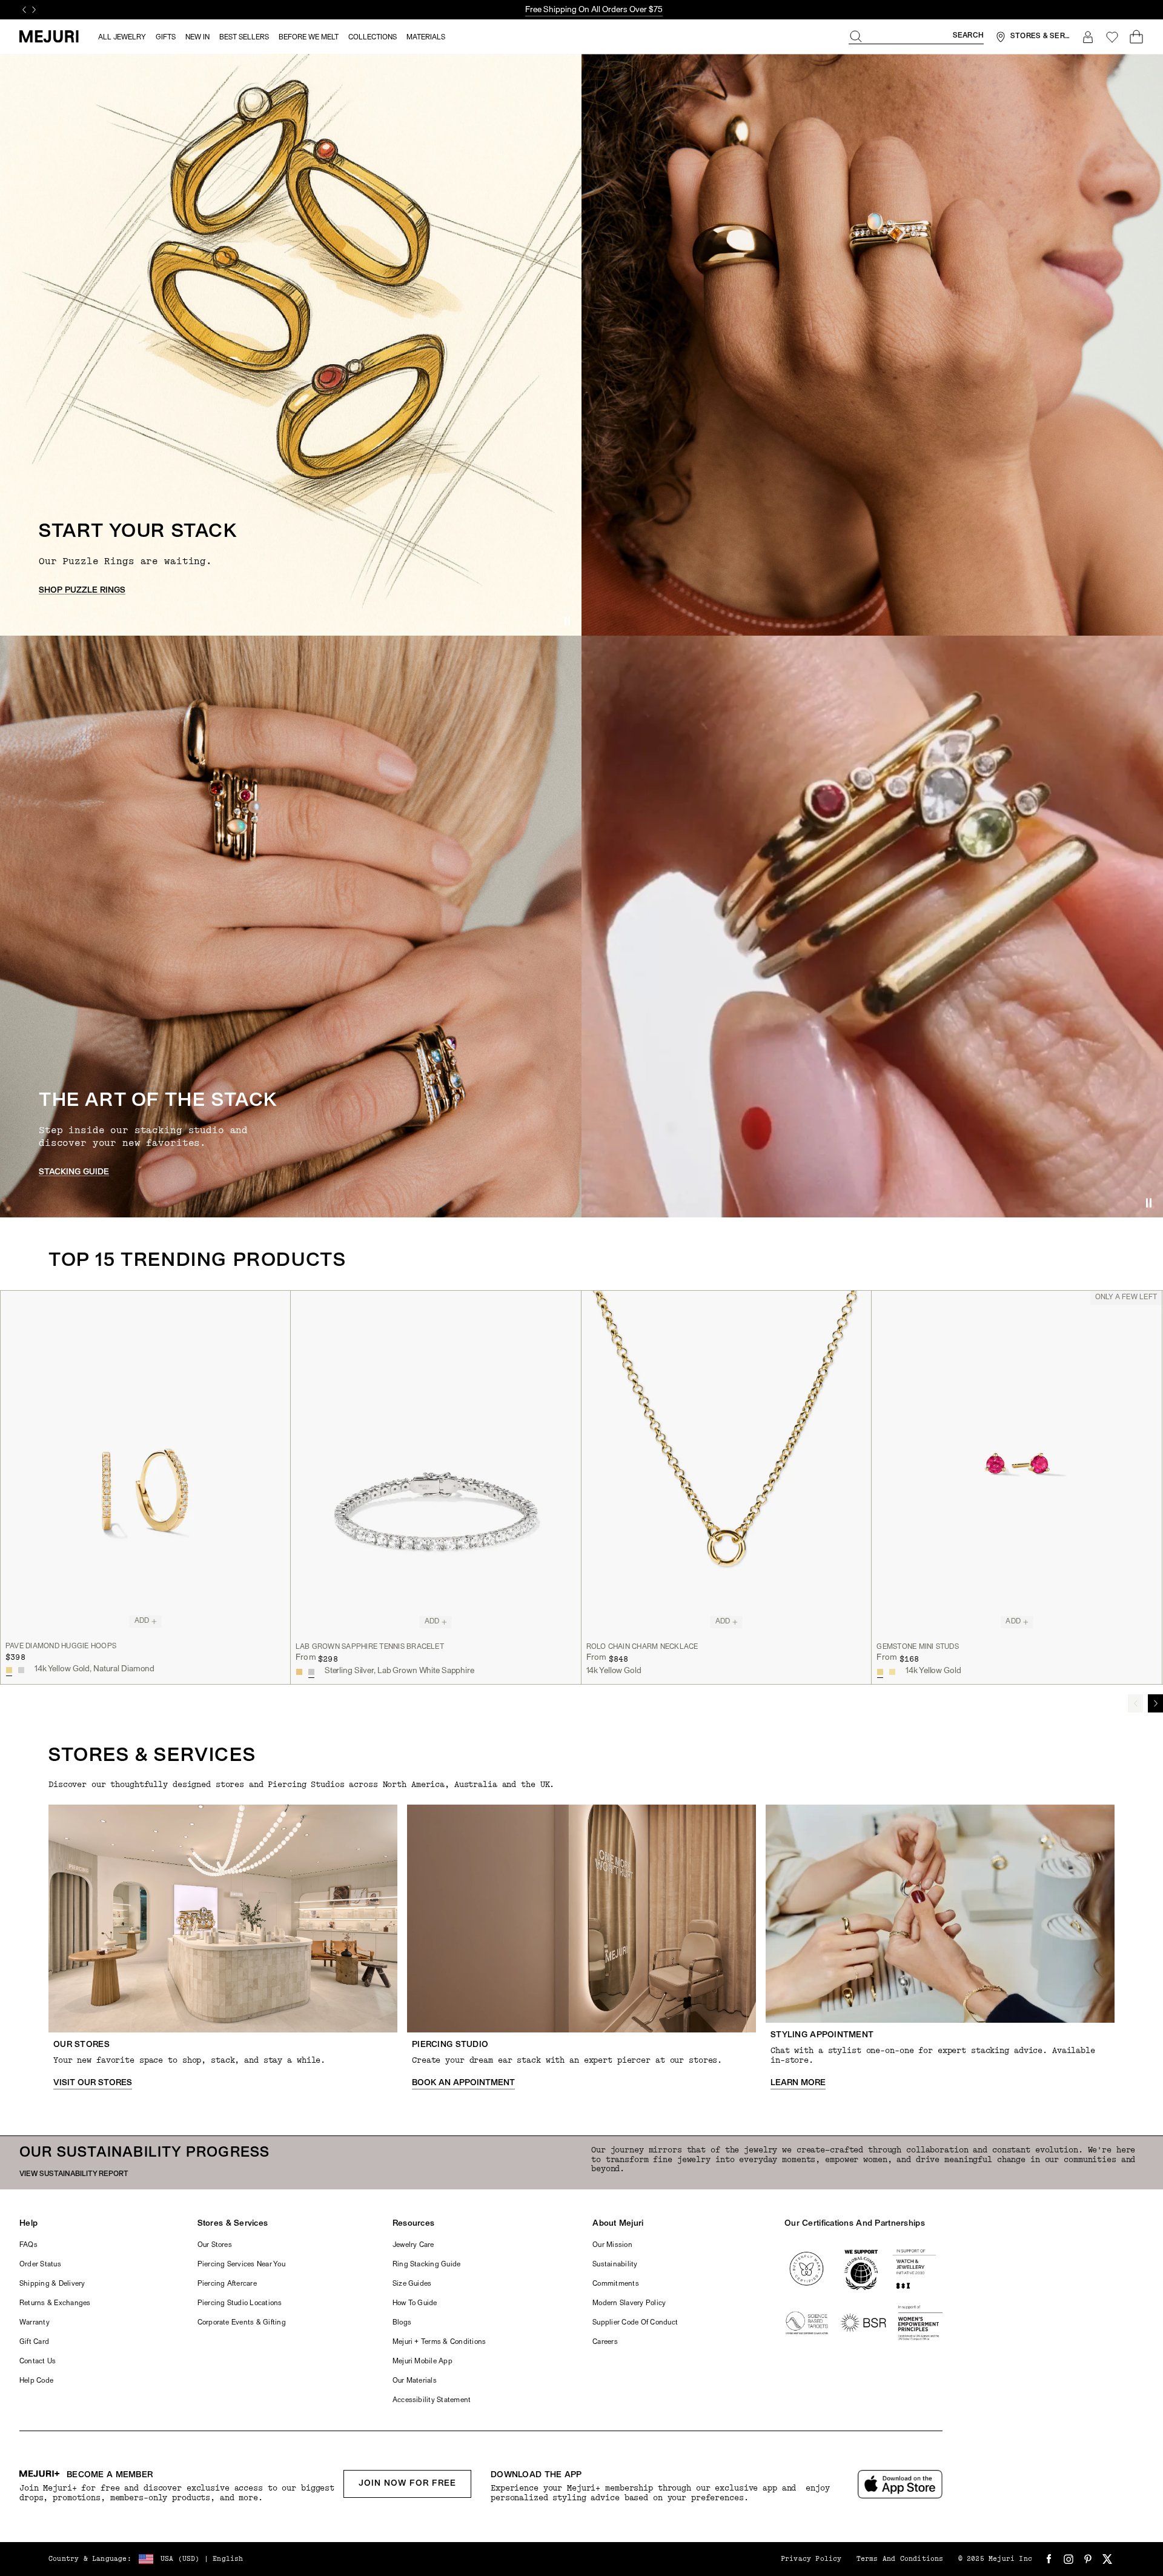
Hero banner with 'Stack Your Story' message
The hero headline receives moderate attention but the 'SHOP PUZZLE RINGS' CTA shows minimal heat, indicating users see the message but aren't engaging with the action button
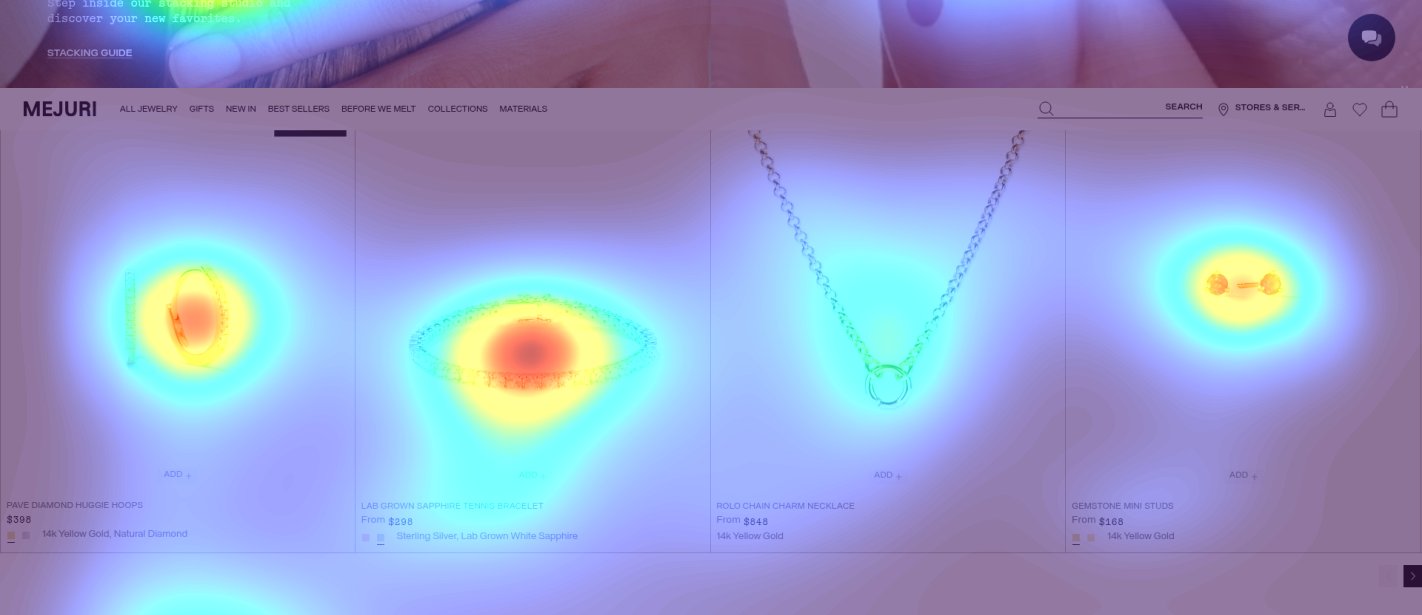
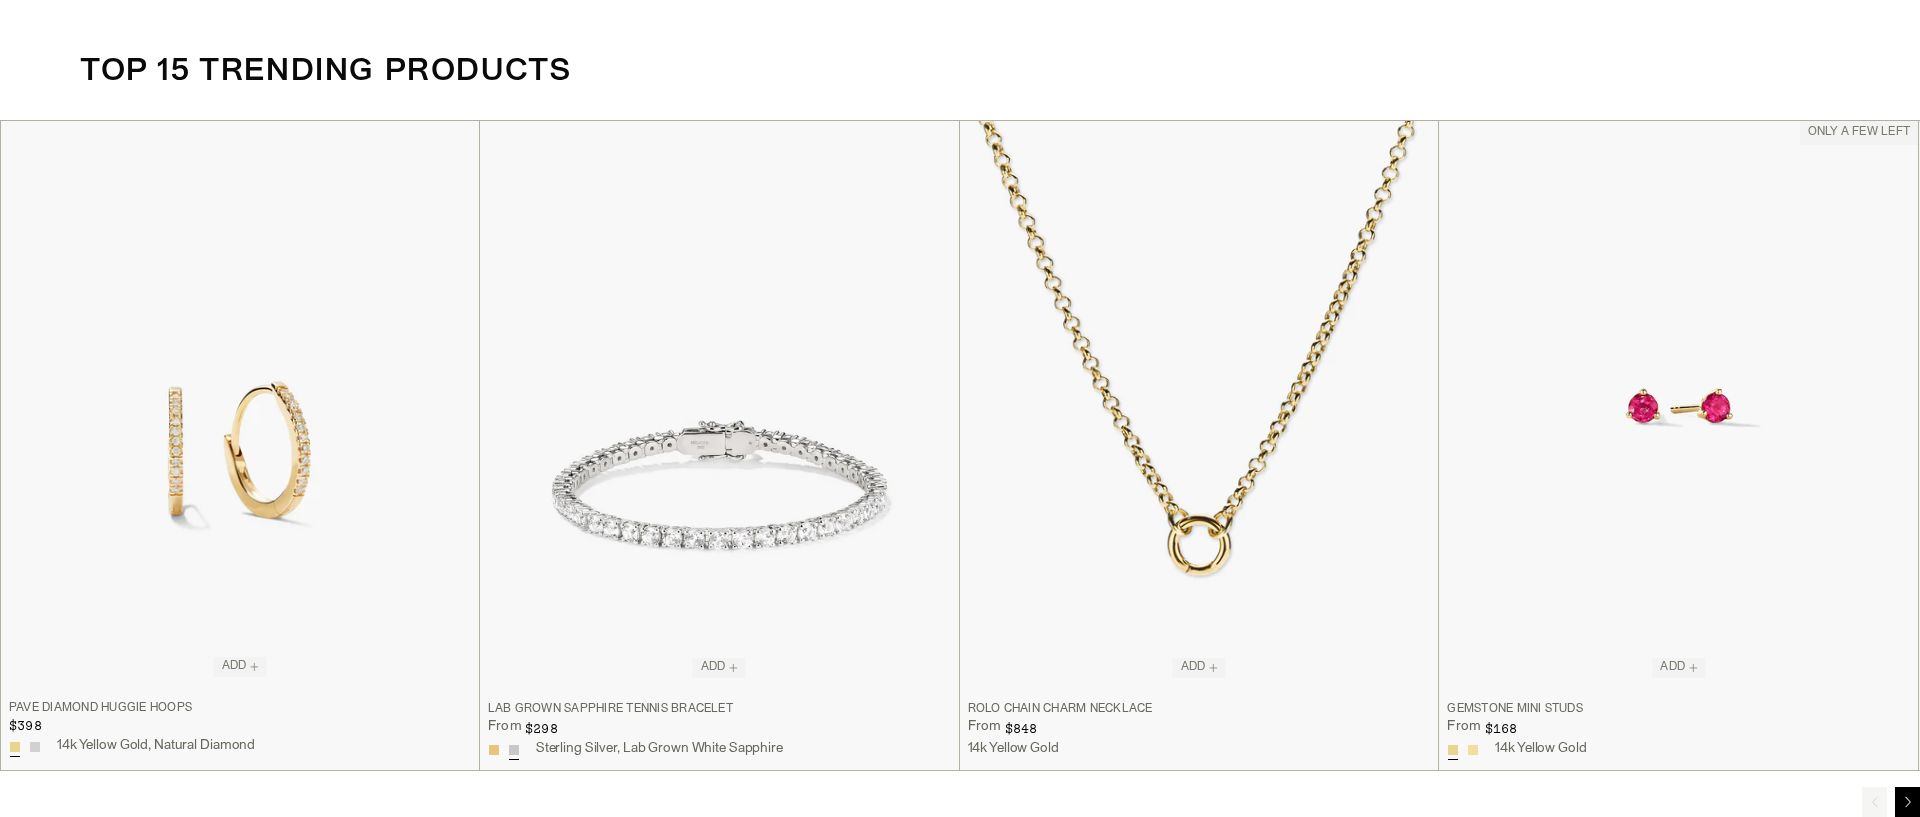
Product grid with pricing
Product images receive strong attention but price points and 'ADD' buttons show minimal engagement, suggesting users browse but hesitate to purchase

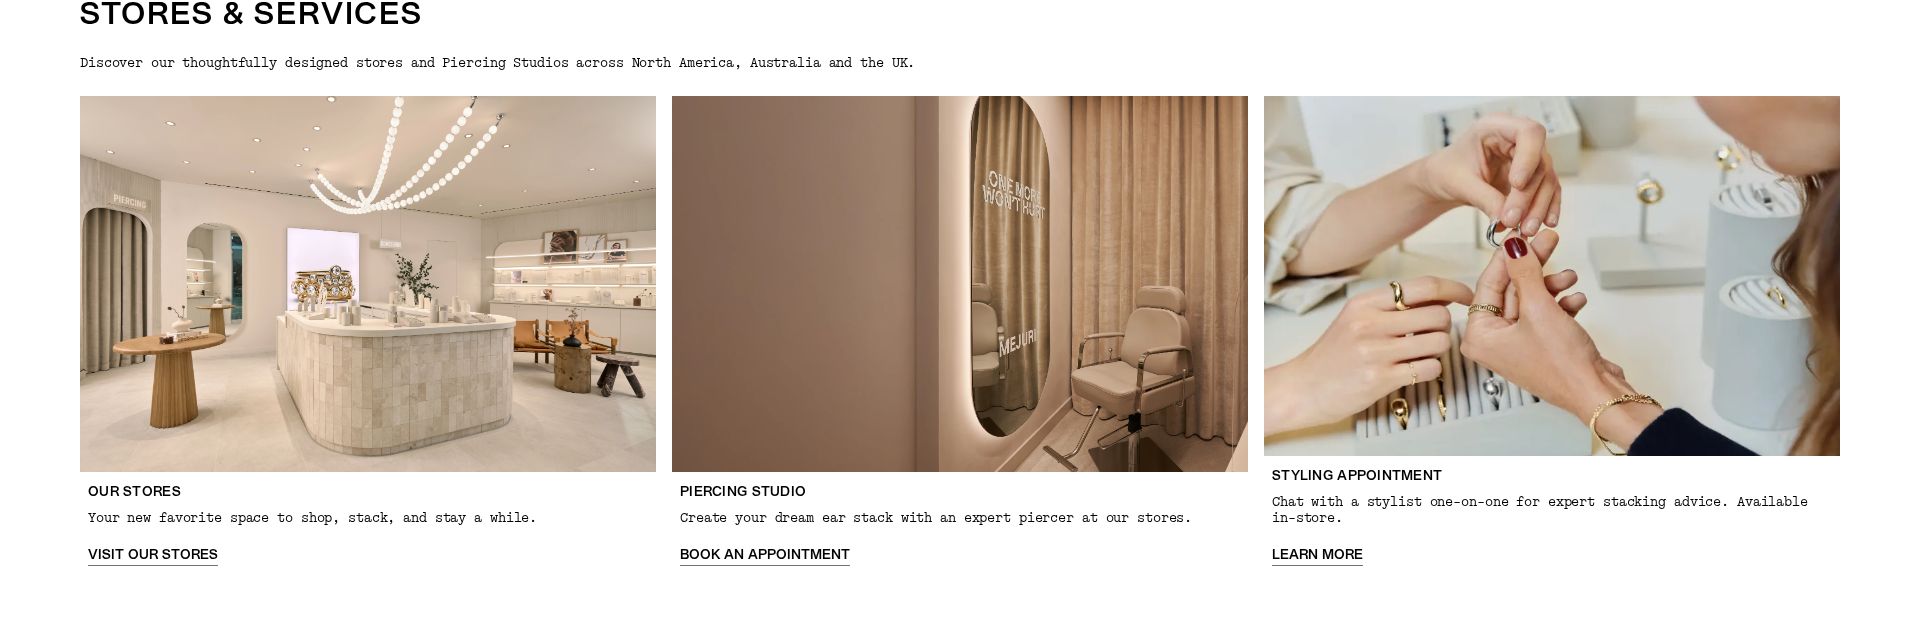
Store locations and services section
Very low attention intensity in the store locator section, with most users not scrolling far enough to see this trust-building content
3 Critical Issues Affecting Mejuri's Conversions
Issue: Enhance Hero CTA Visibility and Engagement
The hero section's 'SHOP PUZZLE RINGS' CTA is receiving minimal attention despite moderate engagement with the headline 'START YOUR STACK', indicating a critical conversion opportunity is being missed
Issue: Optimize Product Grid for Purchase Conversion
Product images receive strong attention but price points and 'ADD' buttons show minimal engagement in the trending products section, indicating purchase hesitation
Issue: Elevate Store Presence Trust Signals
The valuable store locations and services section shows very low attention intensity, with most users not scrolling far enough to see these trust-building elements
3 Specific Changes That Could Increase Revenue by $4.3M
Recommendation 1: Enhance Hero CTA Visibility and Engagement
The hero section's 'SHOP PUZZLE RINGS' CTA is receiving minimal attention despite moderate engagement with the headline 'START YOUR STACK', indicating a critical conversion opportunity is being missed
Transform the text-style CTA into a prominent button with high contrast borders, background color, and hover animation. Position it centrally below the headline with increased size and padding.
Making the CTA more visually prominent and interactive will draw users' natural attention flow from the headline to the action button, improving click-through rates to product pages

Recommendation 2: Optimize Product Grid for Purchase Conversion
Product images receive strong attention but price points and 'ADD' buttons show minimal engagement in the trending products section, indicating purchase hesitation
Implement an interactive product card design that highlights price and ADD button on hover, while adding social proof elements near pricing to build purchase confidence
Creating a more engaging product interaction pattern while reducing purchase anxiety through social proof will improve add-to-cart rates
Recommendation 3: Elevate Store Presence Trust Signals
The valuable store locations and services section shows very low attention intensity, with most users not scrolling far enough to see these trust-building elements
Create a condensed trust bar highlighting store presence and services near the top of the page, featuring key metrics like store count and expert services
Making store presence and expertise immediately visible builds trust earlier in the user journey, supporting purchase decisions
Combined Impact: Here's What Mejuri Could Achieve
A conservative projection based on our methodology
Breakdown by Change
- Enhance Hero CTA Visibility and Engagement $127.5K/mo
- Optimize Product Grid for Purchase Conversion $127.5K/mo
- Elevate Store Presence Trust Signals $105.0K/mo
How Mejuri Would Work With The Good
Our approach lets your team validate our methods before a larger digital experience investment.
Discovery & Baseline
Deep-dive into your analytics and user behavior
Goal Setting
Define success metrics and KPIs
Sprint Planning
Prioritize tests by impact and effort
A/B Testing
Execute, measure, and iterate
Ready to Capture That $4.3M in Revenue?
This is an initial AI-driven assessment to illustrate revenue potential. The next step is a comprehensive optimization program built for you. Every optimization program starts with a digital experience audit. During the audit our team of experts:
- Conducts in-depth user research and analytics review
- Performs heuristic evaluation of your complete funnel
- Identifies the biggest conversion barriers and opportunities in your digital experience
- Creates a prioritized roadmap based on impact and effort
Why Mejuri Should Trust This Analysis
16+ Years Optimization Work
We've optimized hundreds of millions in revenue through our optimization programs.
Fortune 500 Clients
Worked with leading companies including Nike, Adobe, and Xerox.
Data-Driven Methodology
Our analysis is based on thousands of successful A/B tests across industries.