
Do Scroll Maps Help You Increase Conversions? (We Think So)
Knowing scroll depth can help you optimize your pages. It can tell you whether your visitors are really reading your articles or seeing everything you want them to see.

You want visitors to your site to interact with the content you and your staff have worked hard to prepare. You’re looking for clicks, shares, comments, and conversions.
Are your visitors really reading your articles, though, or seeing everything you want them to see? How do you know?
To find out how to boost the numbers you depend on most to show success, let’s look at user experience and user engagement use a type of data many websites have never measured: scroll maps.
Here’s some of what we’ll cover:
- Why social media share counts can be totally unreliable
- The data type that gives you better UX data than share counts
- A step-by-step method for the tactical use of scroll maps
- An on-page example of a scroll map
- A list of the 10 most important scroll map factors
This could be one of the most important analytics updates you make all year. Let’s get started.
One Metric That Can Be Totally Unreliable
Many top blogs no longer allow comments. Ask why, and you’ll typically hear that the spam load got too time-consuming to handle.
Yet for many sites, the real reason is that comment counts dropped as social sharing capabilities rose. Why take time to write a few sentences when you can express your agreement with one quick click?
There’s a problem inside that solution, though. To leave intelligent feedback, you need to take time to actually read (or at least skim) the article.
Social media shares require very little from the visitor and can mean very little to you (depending on your goals).
I’ll prove it to you.
Do you ever share a link based on the headline and/or a quick glimpse alone?
The theory is that shares equal sales, but that’s not the case at all. #socialmedia Share on X
That’s exactly why you see so many posts on “how to create viral titles.”
The theory is that shares equal sales, but that’s not the case at all. It’s possible to get plenty of social shares and not earn a dime because of it.
Scroll Maps May Be the Data You’ve Been Missing
Have you thought about “scroll maps” lately? The term refers to how far down the page a visitor travels.
Do you assume every piece of content you post gets viewed all the way to the end? I hate to break the news to you, but that’s probably not the case.
Scroll maps are one of those things everyone needs to be familiar with, few people understand, and most are afraid to find out.
Like the maxim says, “The truth will set you free” (but first it may make you miserable).
The nights you’ve spent lying awake trying to think of the perfect call to action, and the hours you spent sweating over the design of your opt-in form–those aren’t wasted, but they may not be getting the attention they deserve.
Scroll Maps Answer Questions Other Data Don’t Even Ask
At The Good, our CRO and UX genius Dan Weinsoft heads up testing protocols. Dan knows better than most that what works for your site may not work for someone else.
He also knows there’s a threat to conversion rates that often goes unnoticed. In the rush to compete for popularity (aka social mentions), it’s way too easy for a business or entrepreneur to lose sight of why they want attention in the first place.
Getting more social shares just to get more social shares is wasted effort. In most cases, scroll depth is considerably more important.
Before the mobile revolution, much of your content wouldn’t have required scrolling at all. That has changed completely. You can pretty well expect that mobile readers will need to scroll to view just about any page on your website.
Getting more social shares just to get more social shares is wasted effort. Share on X
How far will they scroll?
That’s the million-dollar question.
Here’s how to find out and what to do about it.
A Step-by-Step Method for the Tactical Use of Scroll Maps
Here’s a disciplined approach to determining scroll depth on your pages and leveraging the lessons there to optimize for the desired results.
-
Set up a system for mapping scroll depth.
The two primary means of doing that are via heatmapping (with a tool like Hotjar) or by tweaking Google Analytics and Google Tag Manager. Check this video tutorial for exact instructions.
-
Pick a page and determine the goal for that page.
What do you want the visitor to think or do while there? Each page can serve several functions, but only one of those functions should be the primary purpose of the page.
-
Observe the scroll map data for that page in light of the goal.
Do you see any correlation between how far visitors scroll down that page and the accomplishment of that goal?
-
If there is a relationship, define it. If not, move on to another page.
-
Form a theory about how you can improve the situation your observations uncovered.
-
Test that theory.
-
Use the data from your test to form another theory.
-
Rinse, wash, and repeat.
An Example of Using Scroll Maps to Formulate Theories
Here’s an example from a website we’re helping to optimize right now. Take a look at the graphic below and notice how the heat map shows visitor attention moves from hot (red) to cold (blue).
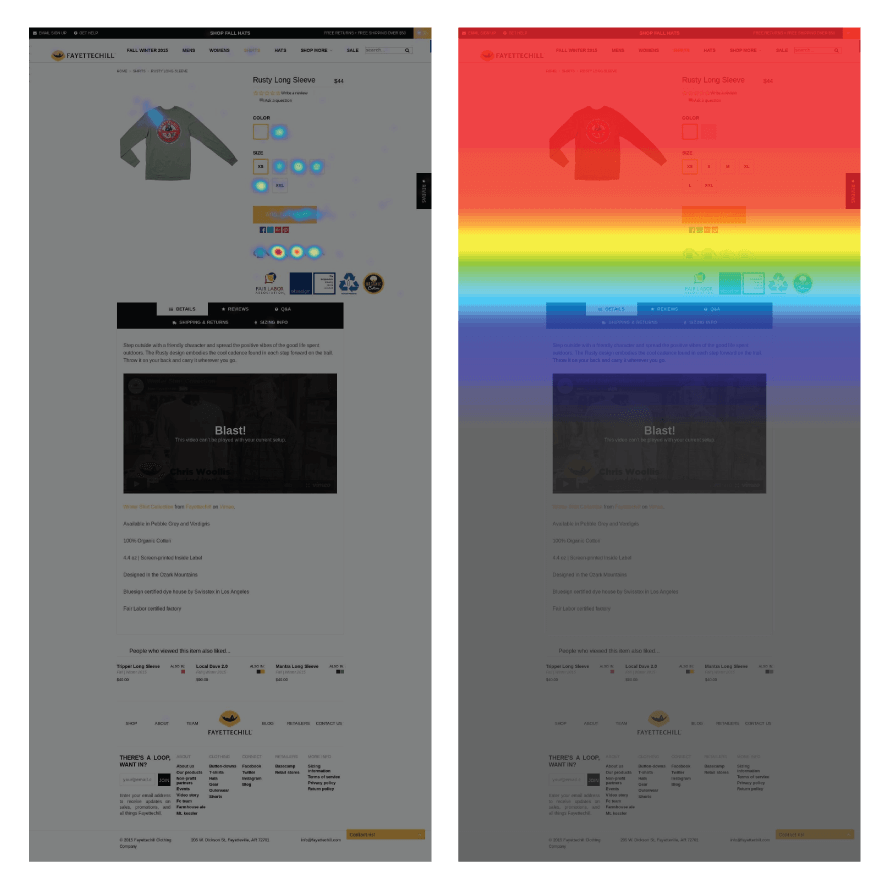
Do you see any on-page clues that could help us understand why interest drops rapidly towards the center?
Depending on the device used to view this page, by the way, that spot could be the fold of the page.
Could it be that the visitor sees the line of icons on top of the dark bar and surmises that the page ends there? Below that bar there are a few more lines of copy, then a video. Want to guess how many plays that video is getting? You’re right… very few.
Before we get too worried about this, though, let’s not forget step two in the sequence outlined above: What do you want the visitor to think or do while on this page?
If the action you want to see happen is for the prospect to click on the bar in the red, things are looking pretty good. We can still optimize to boost the CTR, but this page is pulling its weight already.
However, if the goal here is for the visitor to scroll on down and watch that video, we’ve got plenty of work to do.
We’ll need to hone in on our theory, make a change aimed at getting better results, and test the theory. We’ll then take the findings from that test, learn from the data, and test again until the goal for that page is reached.
It’s a piece of cake, right?
The Top 10 Factors That Can Affect Scroll Maps
Knowing scroll depth can help you optimize your pages. Even though your situation is unique to your niche and your audience, there are certain places we’ve learned to look for clues.
Knowing scroll depth can help you optimize your pages. Share on XIn no particular order, here are the factors that generally pack the most potential. Note the hot and cold spot for your scroll, then use this list for troubleshooting.
-
Check page readability
Online readers want copy served up in chunks of a few sentences each. This is especially true on mobile. Select font size and style with an eye more on readability than appearance.
-
Check page scannability
Your subheads, boldface, bullet points and such should enable a reader to scan the page to determine exactly what can be done there and why he or she should care.
-
Make it interesting
Aim the page at the reader’s interests if you would accomplish your own ambitions. From start to finish, your job is to attract those whom you hope to attract and get them to do, think, or feel whatever the page goal suggests.
-
Don’t try to please everyone
For a sure flop, figure out a provocative page title or headline to draw people in – then fail to deliver on that promise. For a sure winner, know the audience you want to draw and serve up the content they seek.
-
Use images wisely
Unless your business is an online art gallery, your images should support the rest of the page content and do their part in making sure the goal of the page is accomplished. If an image doesn’t do that, don’t use it. Even if the puppy is really, really cute.
-
Listen to your copywriters
Everyone on the creative team fancies themselves a great writer. They’re all self-proclaimed wordsmiths. Just ask them. You pay your copywriters for a reason. Listen to them. At the very least test their copy against management’s edits. You may be surprised at the results.
-
Careful with your headlines
I mentioned this earlier, but it’s an issue that begs to be driven home. The job of a headline or title is to get members of the chosen audience to stop and take a look. Never, ever, never use a flamboyant headline to draw people in only to show them that you can’t deliver on what you promised. Do you like being fooled by that trick? Me neither.
-
Keep the flow going
Just as the headline gets the attention of the right readers, the first paragraph should deserve that attention and lead the reader to take the next indicated step. Your web page is part of the consumer’s journey to research and find the best product for their needs. Make it a good one.
-
Keep the main thing the main thing
Always keep the goal of the page in mind. If you can get that goal accomplished above the fold… great. The only content you really need is the content that guides the visitor to fulfill the goal. Nothing less and nothing more.
-
Play fair
Rather than trying to figure out how to trick the reader into scrolling more, ask how you can provide good reason for the reader to want to scroll more.
Keep this list handy when you’re considering your scroll depth data. Chances are good that your Stuck Point™ is related to one of the 10 factors given. If you need help assessing the situation, get your free Stuck Score™. The Good’s entire focus is on helping you get more conversions and improve your ROI.
Are Scroll Maps the Data You’ve Been Missing?
The only way to know for sure how much of an impact the work suggested here could have on your business is to try and see.
Time after time, we run tests that deliver totally unexpected results. We’ve come to expect the unexpected.
Whatever you do, though, don’t let social shares be the way you measure your success.
Measure scroll depth, learn from the data, and optimize for conversions.
About the Author
Jon MacDonald
Jon MacDonald is founder and President of The Good, a digital experience optimization firm that has achieved results for some of the largest companies including Adobe, Nike, Xerox, Verizon, Intel and more. Jon regularly contributes to publications like Entrepreneur and Inc.