
How RFM Analysis Helps You Segment and Convert Customers Better
RFM Analysis is a customer segmentation method that helps you target your customers with the right message in the right place at the right time based on three key data points.

Not all customers are created equal. Some purchase infrequently (monthly, yearly), while others purchase much more frequently (weekly, or even daily). Oftentimes, different types of customers will want different things from your company, so your most effective marketing efforts will generally be targeted to meet each customer’s unique needs and demands. For example, using an RFM analysis.
When you can uncover behavioral patterns in your customer groups, you can tailor your marketing strategy to target each group with the right message, in the right place, at the right time, leading to a higher opportunity for conversions.
For example, if you’re an ecommerce coffee retailer and know that your customers tend to re-order every 30 days, would an email promotion be most effective 10 days after their initial purchase or 25 days? (Answer: The latter)
So, how do you know to whom you should send what messaging, and how often you should send it? If you’re a marketer struggling to answer these questions, RFM analysis might be the solution you’re looking for.
| RFM analysis is a customer segmentation technique used to prioritize customers. It uses three key data points—recency, frequency, and monetary value—to create a scoring system that segments customers into groups based on their value to a company. |
This Insight will cover how you can use the RFM model in your marketing, and how it can be applied to increase conversions on your site. We’ll start with the parameters that make up an RFM score.
The Parameters of RFM Analysis
The RFM score is the aggregate of three parameters: recency, frequency, and monetary value. For clarity, we’ll define each parameter as it relates to RFM.
- Recency is calculated based on how long it’s been since a customer’s last purchase. It’s the most effective way of determining who’s going to buy from you today. Essentially, a customer who’s made a recent purchase with you is considered more valuable than a customer who hasn’t ordered in a while.
- Frequency is the number of purchases a customer has made in a specific time frame. It can be a good indicator of how often a customer interacts with your brand. That can give you an idea of how often you should try to reach them through marketing.
- Monetary value is simply the amount a customer spends on your product or service within a given time frame. While it’s not as good as the other parameters at predicting when a customer will buy from you again, it can give you an idea of how much they might spend if they do.
Each of these parameters contains a valuable piece of information about your customer’s past behavior. Similar to customer lifetime value, the RFM score can offer insight about what a customer is likely to do in the future. To understand the benefits of using multiple parameters, let’s look at some of the shortcomings of singular segmentation:
- A business that segments based on recency alone knows who their best customers have been lately. What they don’t know is how much these customers are likely to spend on your product. And while recent customers are most likely to be repeat customers, it’s hard to gauge their value without knowing how often or how much they are likely to spend.
- A company that performs its customer segmentation based solely on frequency knows how often their customers buy from them. That allows them to predict how often they’ll buy in the future. Focusing exclusively on this parameter, however, leaves them bereft of knowledge about a customer’s overall value.
- Finally, a business that segments customers based on monetary value knows the value of a given customer, but not if they will maintain that value.
In RFM analysis, all of this customer behavior data is combined into a single score that gives a more complete profile of any given customer. That profile allows companies to create targeted marketing campaigns that are likely to yield higher conversion rates.
By now you’ve probably realized the potential of implementing RFM analysis at your organization. So, how exactly do you do it?
Creating an RFM Model for Your Business
RFM analysis starts with organizing your customer purchase data. You’ll want to choose a range that is in alignment with your sales expectations. If you can reasonably expect a great customer to make a purchase every week, an ideal range might be six months to a year. If you can only expect one to two purchases a year, a five-year range might be more appropriate.
If you can, stick to a shorter range. RFM analysis is most effective when applied to one- or two-year period. To start, you’ll need three data sets from that period for each customer:
- Time (days) since the customer’s last purchase (recency) Note: You can find this in Google Analytics under Audience > Overview > Frequency and Recency
- A log of all the times the customer made a purchase in the data period (frequency)
- The total amount the customer spent within the data period (monetary value)
After gathering and organizing your customer data, it’s time to create a scoring system. Unless you’ve got the time and need for more precise grouping, it’s best to keep this simple. A 1-5 scale for each parameter works perfectly well, with 1 representing the lowest value customer and 5 being the highest.
These scores are also determined by your sales expectations. If you use a 1-5 scale, you’ll determine the range of each quintile based on prior interactions customers had with your company. This chart below offers an example of a potential range for a customer’s frequency score.
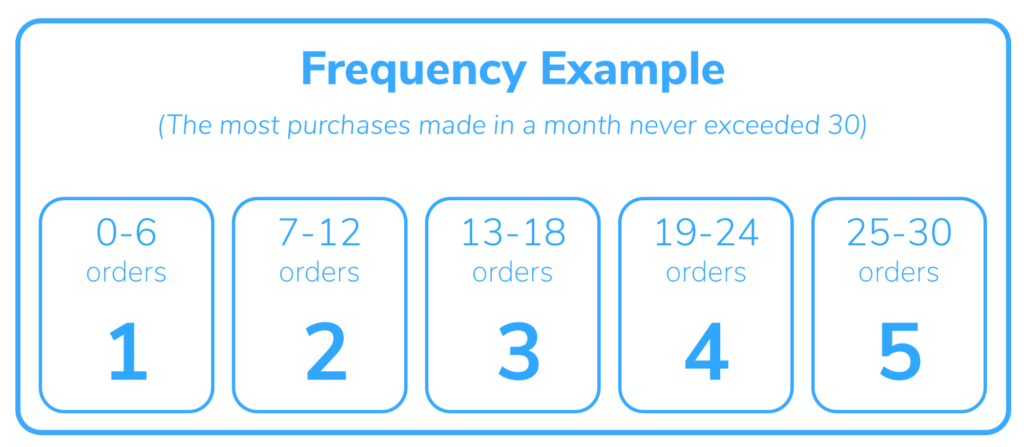
For the sample company above, the dataset period is a month and the most consistent customer bought 30 times. That put the 5 score for frequency at anything 25 or higher.
You’ll use this same method to determine the ranges for the other parameters.
Let’s say you’re a coffee distributor. If your most frequent customers make an order once a week, a 5 score would represent the 52 purchases they make throughout the year. A customer who purchased in the past week would get a 5 for recency. If your big spenders bought about $60,000 worth of coffee beans in the data period, anything above $50,000 spent during that period might be your 5 for monetary value, above $30,000 might be a 4, and so on.
Organizing the Data From Your RFM Analysis
Once you have all your data collected and scored, you’ll want to organize everything into a table like in the example shown below.
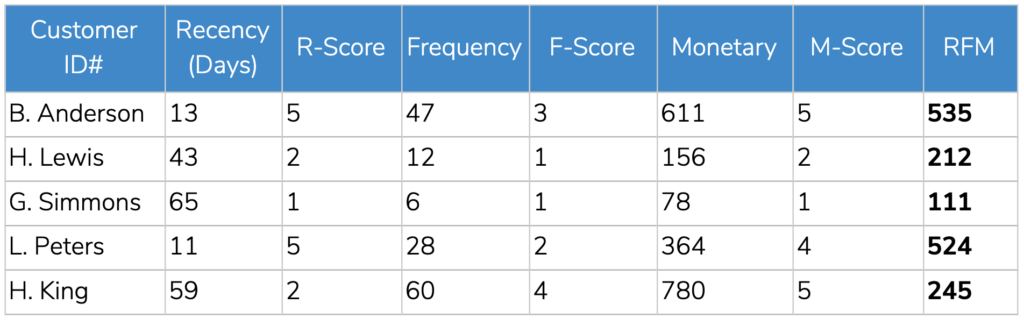
As you can see, an RFM score isn’t calculated by adding the parameter scores together. Rather, it’s the result of combining each of them to form a weighted score. It works this way because each parameter is weighted differently, with recency holding the highest weight and monetary value holding the lowest.
In the chart above, the highest-rated customer has a recency score of 5, a frequency score of 3 and a monetary score of 5. That gives them a total RFM score of 535. The lowest-rated customer has a score of 111, indicating that they were in the lowest quintile for all three parameters.
All this data serves as an indicator of how valuable a customer is to your business. Customers with the highest RFM scores should be your highest priority in crafting your marketing. Customers with the lowest scores should be the lowest priority.
The beauty of RFM is that it doesn’t require you to ignore lower value customers in favor of higher value ones or to prioritize lower value customers to increase their scores. It allows you to offer each group what they want, and in doing so potentially increase all of their scores.
Utilizing RFM Analysis in Marketing
Once you’ve segmented your customers by their RFM scores, you can market to different groups based on their needs. This can be especially helpful in creating targeted email marketing campaigns.
So, how do you utilize RFM analysis as a part of your marketing strategy?
Generally, higher scoring groups respond well to deals that reward their loyalty. They like your brand already; you just need to ensure they continue to. That means offering your high-value customers special deals, bulk discounts, exclusive trials, membership to your loyalty program, etc. When you have a new product, they should be the first customers to know.
Lower scoring groups should be reminded about your brand. Send them previously viewed or wish-listed products. They saw value in your company at one point—try to make them remember why.
The key is to only send messages that a given group is likely to be interested in. A customer who places large orders every month doesn’t need to be reminded of your brand. On the other hand, someone who makes small orders once a year isn’t likely to be interested in bulk discounts.
RFM Analysis Is an Effective Means of Appealing to Different Customer Segments
A lot of marketing is geared—intentionally or unintentionally—towards attracting new customers. For many online businesses, however, 50 percent or more of sales come from retention. That means you should be spending the same amount of resources on keeping on your current customers happy as you do on attracting new ones.
If you’re focused on an email (or direct) marketing strategy, RFM analysis offers an effective means of segmenting your customer base and ensures you send each segment the content and messaging that’s likely to yield the highest conversion rate.
Marketing is about anticipating what a customer wants and creating a resistance-free path to their getting it. The key to creating that path is understanding what they want before you send them anything they don’t. RFM analysis shows you what a customer wants, so you can market it to them.
If you’re looking for actionable ways to increase the conversion rate of your ecommerce site, it may be time to consider digital experience optimization (DXO). At The Good, we focus on improving companies’ digital experiences through our own process of data-backed decision-making.
About the Author
David Hoos
David Hoos is the former Director of Marketing at The Good and a trusted advisor to marketing experts.